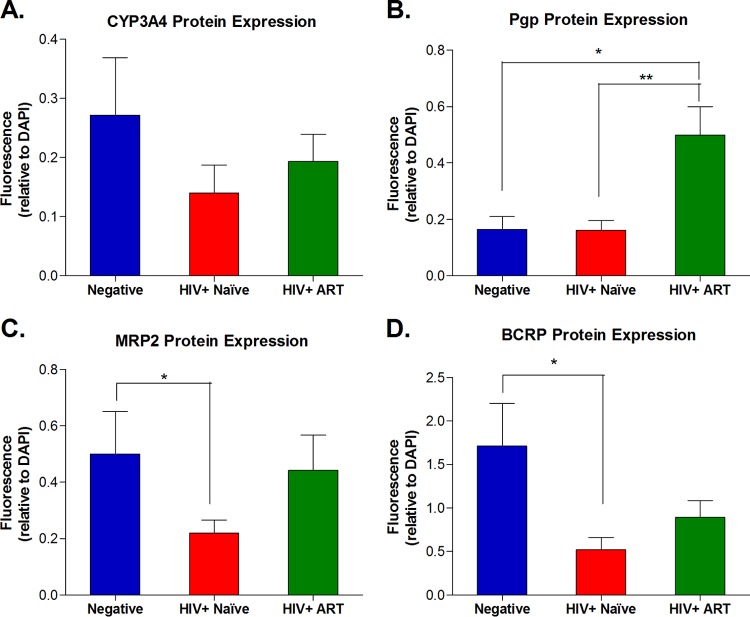
FIG 4.
Group comparison of protein expression levels estimated from relative fluorescence intensities of immunostained jejunal tissue slices. For each protein of interest, all fluorescent images obtained from tissue slices from each subject were analyzed using the Image Pro Premier software (Media Cybernetic, Rockville, MD). The fluorescence intensity (integrated optical density [OD], lumens/pixel2) for the protein of interest, i.e., CYP3A4 (A), Pgp (B), MRP2 (C), or BCRP (D), was normalized to the intensity of nuclear staining (i.e., the integrated OD measured for DAPI) within the same area. This analysis was performed in triplicate on three different areas within each tissue slice obtained from each study subject. The average normalized intensity ratio (gene of interest/DAPI) for each subject was used to estimate the mean ± standard error of the mean (SEM) for the study group. Statistically significant differences in protein expression between groups (negative versus HIV+ naïve, negative versus HIV+ on ART, and HIV+ naive versus HIV+ on ART) were determined using GraphPad Prism software, version 5.01 (Graph Pad Software, San Diego, CA) by applying the nonparametric two-tailed Mann-Whitney test with significance defined by a P value of <0.05.

