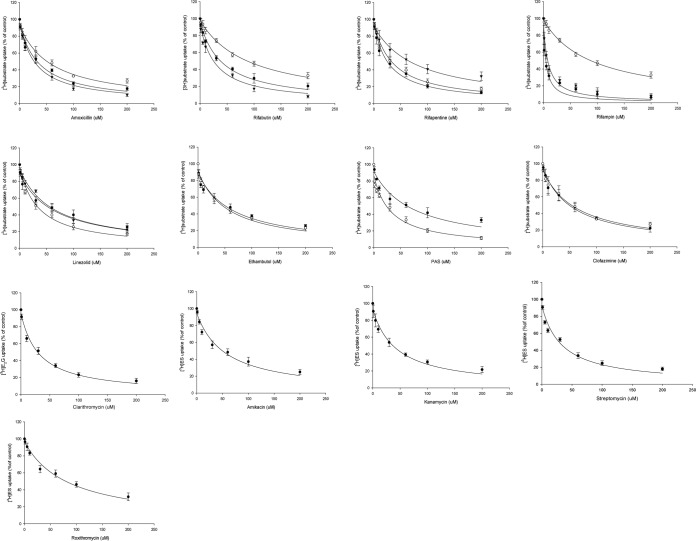
FIG 3.
Estimation of the inhibitory kinetics of anti-TB drugs on 45 nM [3H]ES and 60 nM [3H]E2G uptake into transfected HEK cells. Inhibitory properties overlapped for those drugs as the three-line graphs represent OATP1B1 (○), OATP2B1 (●), and OATP1B3 (▼), two-line graphs represent OATP1B1 (●) and OATP1B3 (○), and a single-line graph represents clarithromycin for OATP1B3-mediated E2G and amikacin, kanamycin, streptomycin, and roxithromycin for OATP2B1-mediated ES uptake, respectively. The estimated IC50 was calculated by nonlinear kinetics using Winnonlin 6.0. Data are presented as the mean ± SD, relative to the control (no inhibitor), from three or more independent experiments.

