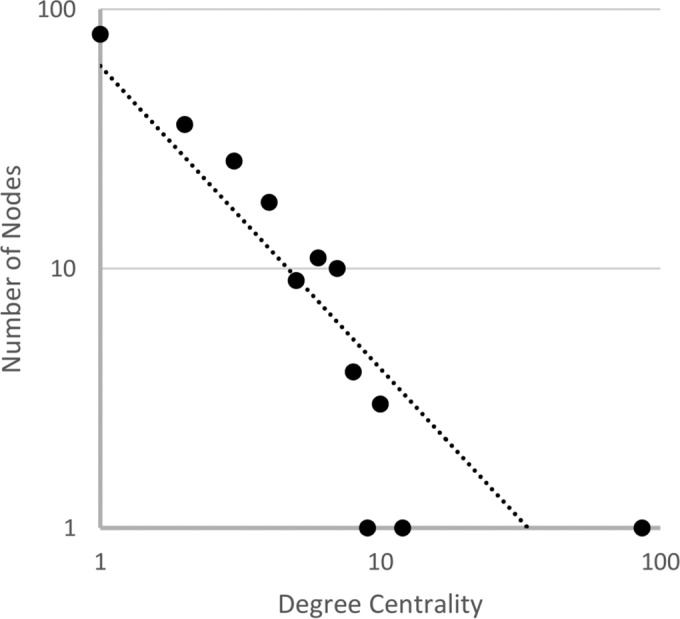
FIG 3.

Number of nodes as a function of their degree centrality. The distribution of the degree centralities was approximated with a power function y = 60.401x−1.167, in which x is the degree centrality and y the number of nodes that have this degree centrality.
