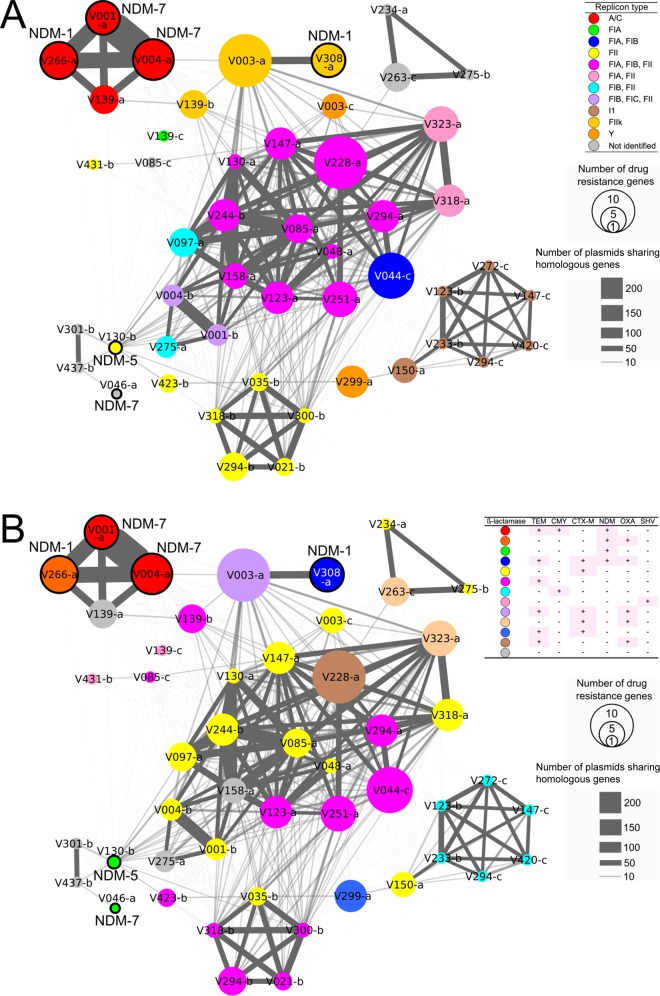
FIG 4.
Network community analysis of the 49 selected plasmids based on the whole or draft plasmid genome sequences. Each circle represents a plasmid. The circle diameters correlate with the number of antimicrobial resistance genes in the plasmid. blaNDM-positive plasmids are highlighted by black borders. Plasmids sharing at least 2 homologous genes (at least 100% identity at the amino acid level, 90% ORF coverage, and a length difference of less than 10%) are connected by gray lines. The widths of the gray lines correlate with the quantity of homologous genes shared. Each plasmid is colored by replicon type (A) or the pattern of possession of β-lactamase genes (B). The prefix “p” was removed from the plasmid names.

