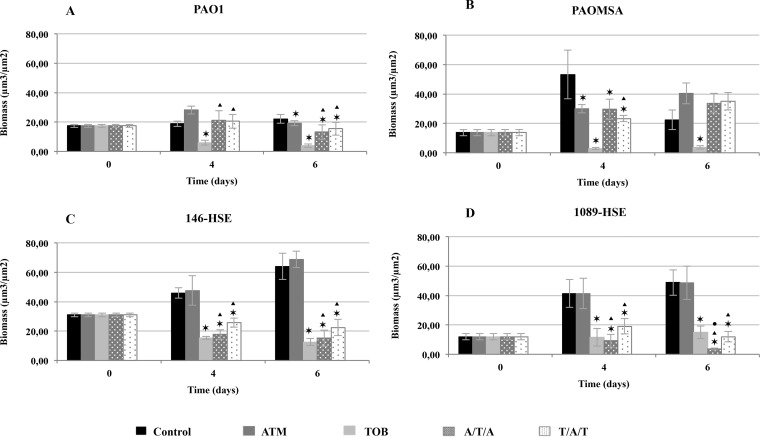
FIG 4.
Biomass analyses of treated biofilms with 1/10-peak concentrations (70 mg/liter ATM and 100 mg/liter TOB) obtained with the COMSTAT program. The results represent the means (bars) and standard deviations (error bars) from at least three independent experiments. *, statistically significant difference between treatments and the control; ▲, statistically significant difference between ATM and sequential treatments; ●, statistically significant difference between TOB and sequential treatments.

