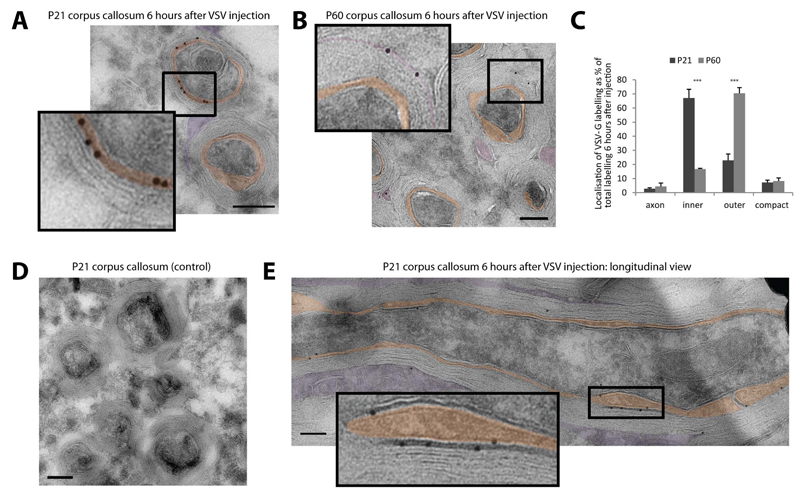
Figure 3. Tracking membrane trafficking using the vesicular stomatitis virus G protein in vivo.
(A-B) High-titer stocks of VSV were injected into the corpus callosum of P21 and P60 mice. The subcellular localization of VSV-G in the myelin sheath was determined by immunoelectron microscopy 6 hours after infection at P21 (A) and P60 (B) mice (orange: inner tongue, purple: outer tongue). (C) Quantification of the VSV-G labeling distribution within the different domains of the myelin sheath at P21 and P60. Bars show mean ± SD (n=3, 100 axon per animal, ***p < 0.001, t-test). (D) No background staining of the VSV-G antibody after control injections without virus into the corpus callosum at P21. (E) Localization of VSV-G at the inner layers in longitudinal section of P21 corpus callosum 6 hours after VSV injection. Scale bars= 200nm; gold size= 10 nm. See also Figure S3.

