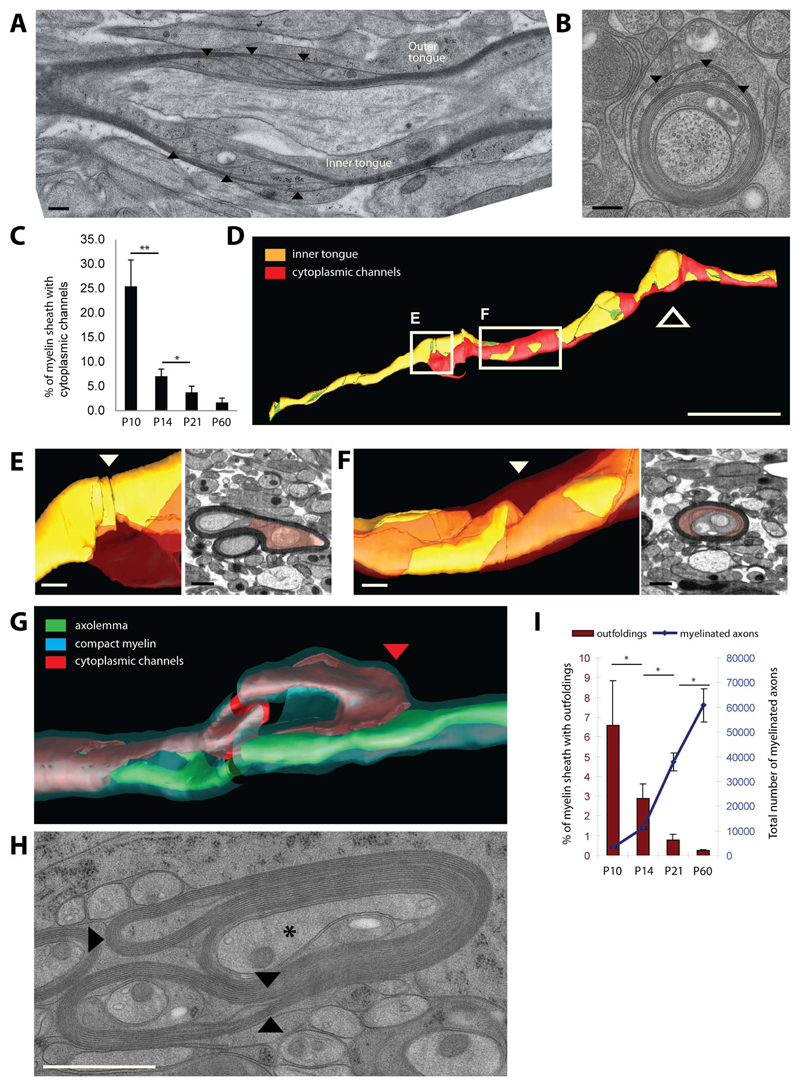
Figure 4. Cytoplasmic channels and myelin outfoldings appear transiently in developing myelin sheaths.
(A, B) Longitudinal and cross sections of P10 optic nerve myelinated axons showing cytoplasmic channels within the compact myelin indicated by arrow heads. Scale bar=200nm. (C) Percent of myelin sheaths with cytoplasmic channels at P10, P14, P21 and P60. Bars show mean ± SD (n=3, 200 axons per animal, *p < 0.05 **p < 0.01, t-test). (D) Three dimensional organisation of the cytoplasmic channels (red: cytopalsmic channels, orange: inner tongue, green: axolemma) along the myelin sheath (thick arrow signals the location the oligodendrocyte process). Scale bar= 10µm. (E,F) Model and electron microscopy views of the area where the cytoplasmic channels (red) reach the inner tongue (arrowhead: position of the EM views). Scale bar= 500nm. (G) Spatial organization of cytoplasmic channels (red) running inside the outfolding and reaching the inner tongue at the lateral end of the outfolding (red arrow head). (H) Cross section morphology of myelin outfolding (arrowheads) in P10 high pressure frozen optic nerve (star labels the axon with a normal myelin sheath). (I) Amount of myelin outfoldings in myelinated fibers in optic nerves between P10 and P60. Bars show mean ± SD (n=3, 200-800 axons per animal, *p < 0.05, t-test). See also Figure S4.

