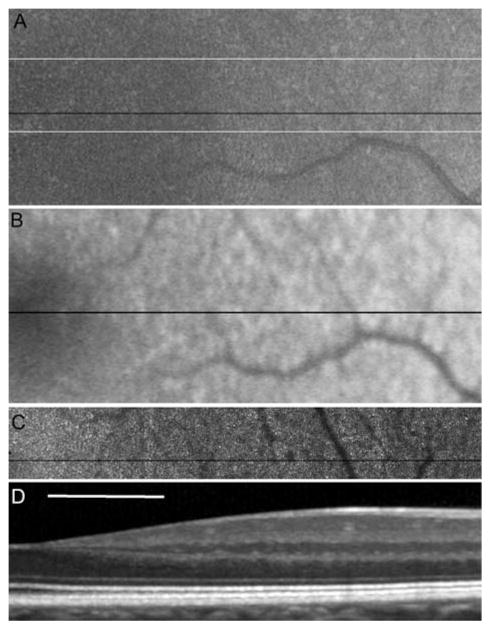
Fig. 38.1.
Images of the right eye of a normal subject. The fovea is on the left edge of the image. Scale bar is 1° (~ 300 μ) (a) fundus photograph, (b) FAF, (c) AOSLO and (d) SD-OCT. The black lines on a, b and c indicate the exact location of the SD-OCT scan. The thin white lines on (a) indicate the exact bounds for the AOSLO image overlay. Image (b) shows the expected decrease in AF toward the fovea. The AOSLO image shows resolved photoreceptors with increasing spacing with distance from the fovea (left to right). The OCT image shows the typical layered structure, including well-defined inner and outer segments expected for a healthy photoreceptor layer

