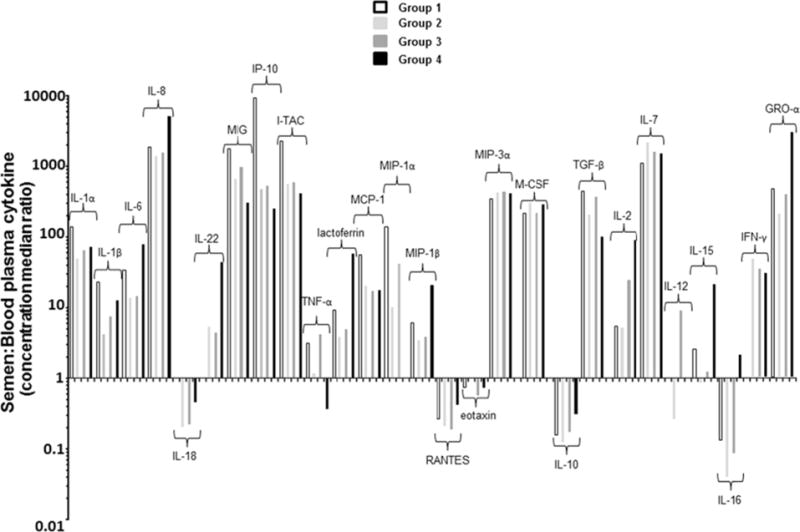
Figure 3.

Cytokine spectra are different in blood and seminal plasma. Median of cytokine concentration ratios in seminal plasma and blood plasma (S:B) are shown for HIV-uninfected controls (group 1, white bars), HIV-infected individuals in early (group 2, light grey bars) or in a later stage (group 3, dark grey bars) of HIV infection and HIV-infected individuals under antiretroviral treatment (ART) (group 4, black bars). Ratios >1or <1 indicate enrichment of a cytokine in semen or blood plasma, respectively. Ratios for some of the cytokines in which concentration remained under the limit of detection either in blood or seminal plasma were not reported in Figure 11 (IL-17, IL-33, GM-CSF and IL-13).
