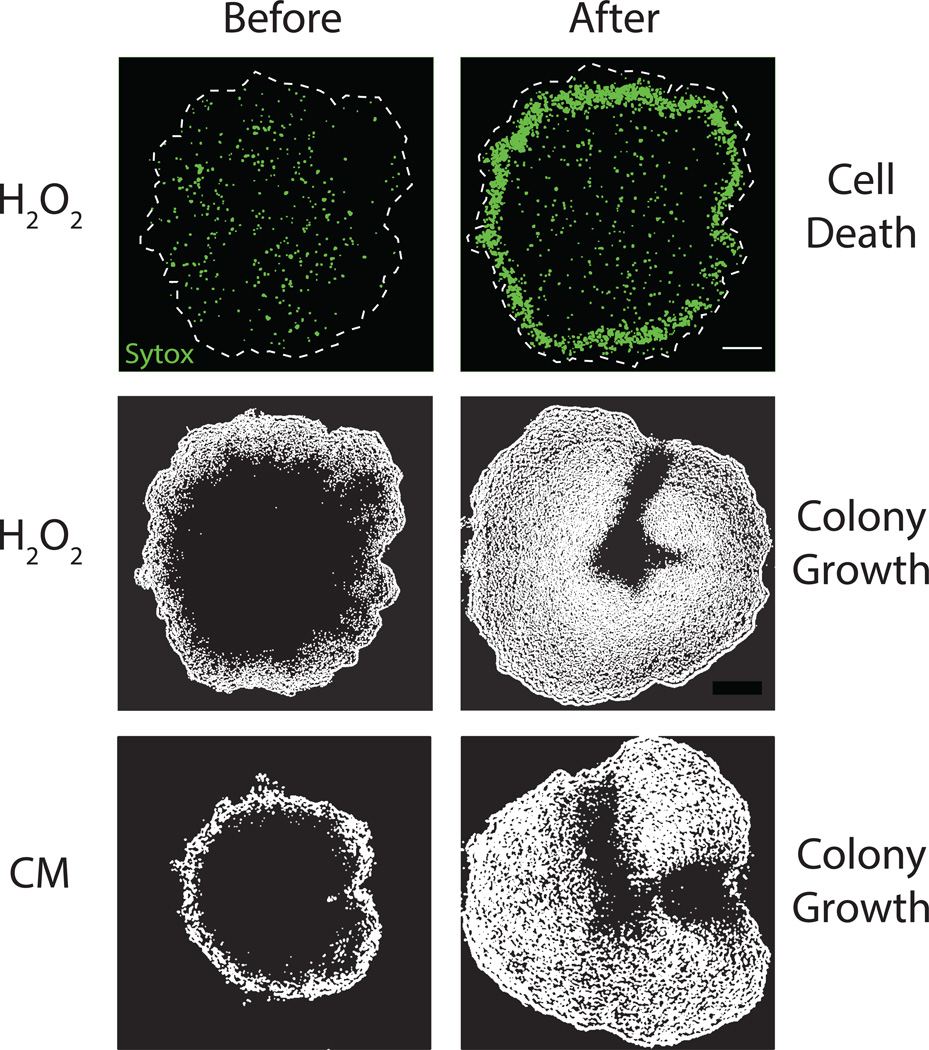
Extended Data Figure 8.
Effect of external attack with hydrogen peroxide (H2O2, 0.15% v/v) or chloramphenicol (CM, 5 µg/ml). (Top) cell death shown by Sytox Green (1 µM). (Middle and bottom) colony growth shown by image differencing (see Extended Data Fig. 4a and Methods: Data Analysis). Scale bar represents 100 µm. The white dashed lines indicate colony edge.

