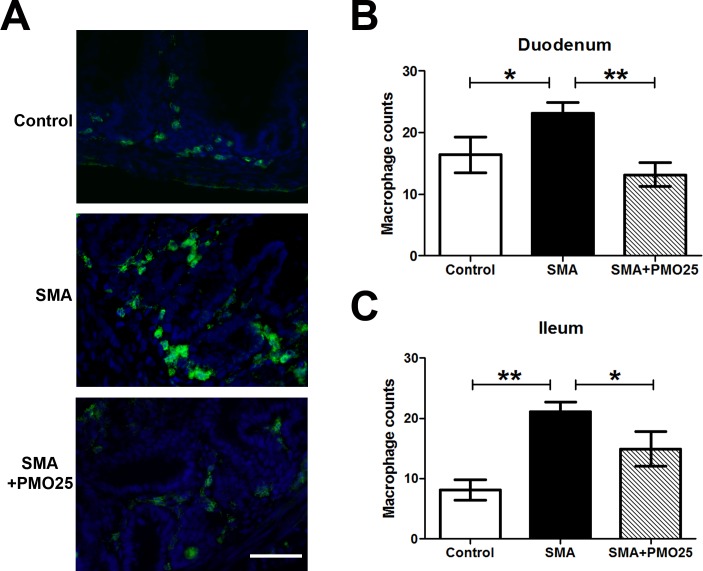
Fig 5. Increased macrophage infiltration in the gut of SMA mouse.
(A) Representative image of macrophage staining in duodenum segment in SMA, control and PMO25 treated mice. Macrophages were stained with F4-80 antibody (green) and nuclei were stained with DAPI (blue). The absolute macrophage numbers per area in duodenum (B) and ileum (C) in three groups of mice. (N = 6. * P < 0.05; ** P < 0.01). Scale bar = 25 μm.

