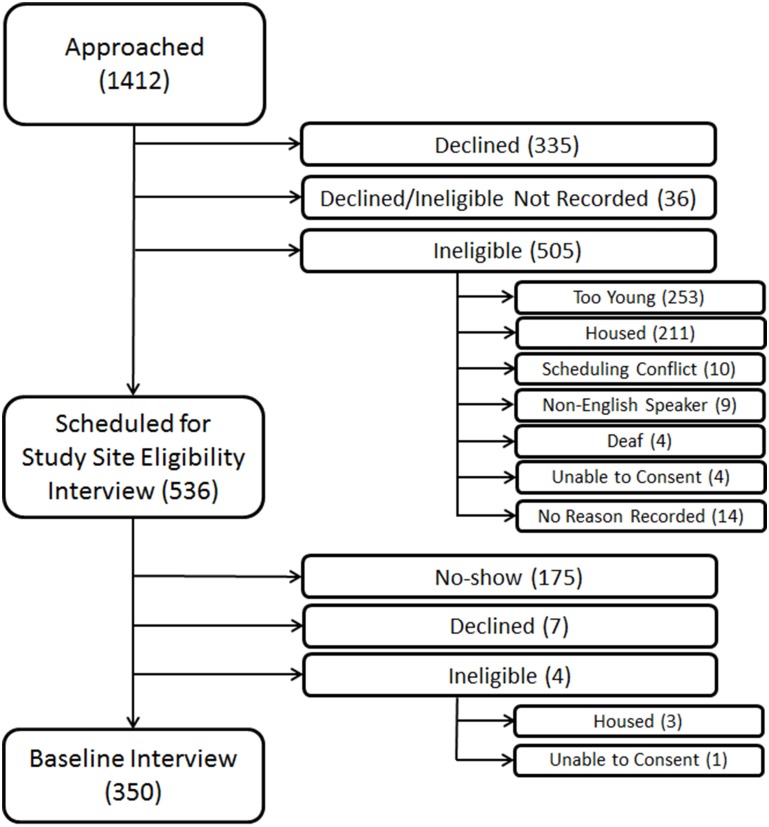
Fig 1. Flow-chart of recruitment of 350 older homeless adults.
This figure shows the number of individuals approached, assessed for eligibility, and enrolled in the study (N = 350), noting specific reasons for inability to enroll. Values represent the number of individuals in each group. *Participants who declined after being approached (N = 335) declined before being assessed for eligibility. Therefore, the number of participants who were ineligible for the study may have been higher than the numbers presented in this figure.

