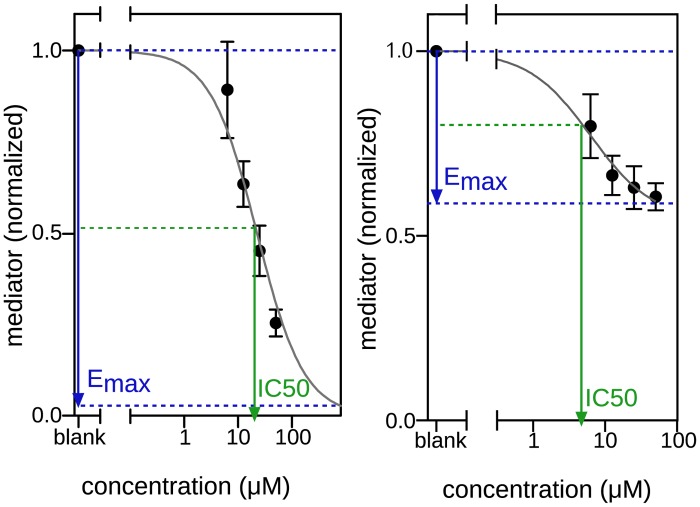
Fig 3. Dose response curve explanation.
Two dose response curves are displayed. The first with a maximum effect (Emax) of close to 100% and the second with an Emax of less than 50%. The IC50 is the concentration at which 50% inhibition of the Emax is observed. Compounds with an Emax < 30% and/or R2 < 0.70 were considered not to be inhibitory even if an IC50 could be calculated.

