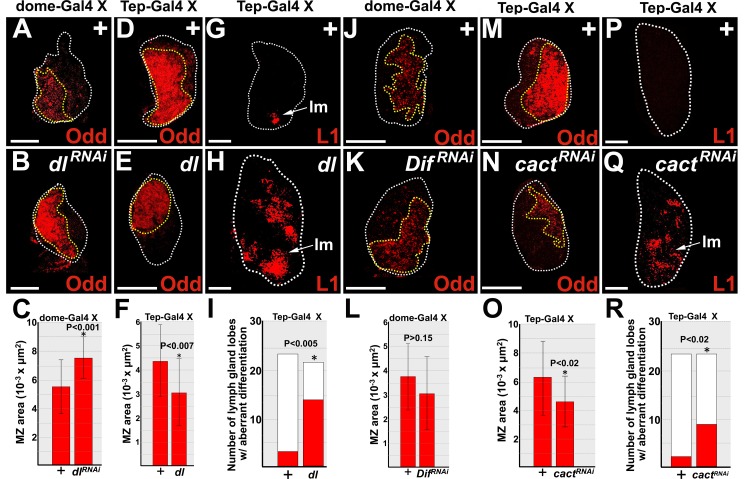
Fig 1. Dorsal and Cact regulate prohemocyte differentiation.
(A-C,J-L) dome-Gal4 or (D-I,M-R) Tep-Gal4 females were crossed to control (+) males or males that carry UAS-dl, UAS-dlRNAi, UAS-DifRNAi, or UAS-cactRNAi transgenes. (A,B) Knockdown of Dorsal (dlRNAi) significantly increased the size of the MZ compared to controls (+). (C) Histogram showing the size of the MZ significantly increased in lymph glands in which Dorsal was knocked down (dlRNAi). Student’s t-test; error bars show standard deviation; P values are as shown; control and dlRNAi (n = 18). (D,E) In contrast, over-expression of Dorsal (dl) significantly reduced the size of the MZ compared to controls (+). (F) Histogram showing the size of the MZ was significantly reduced in lymph glands in which Dorsal was over-expressed. Student’s t-test; error bars show standard deviation; P values are as shown; control and dl (n = 21). (G,H) Over-expression of Dorsal significantly increased lamellocyte differentiation. (I) Histogram showing that aberrant lamellocyte differentiation was significantly increased when Dorsal was over-expressed. Fisher’s Exact test; P value is as shown; control (n = 24), dl (n = 22). (J,K) Knockdown of Dif (DifRNAi) had no effect on the size of the MZ. (L) Histogram showing the size of the MZ was not affected in lymph glands in which Dif was knocked down. Student’s t-test; error bars show standard deviation; control and DifRNAi (n = 19); P values are as shown. (M,N) Knockdown of Cact (cactRNAi) significantly reduced the size of the MZ compared to controls (+). (O) Histogram showing the size of the MZ was significantly reduced in lymph glands in which Cact was knocked down. Student’s t-test; error bars show standard deviation; P values are as shown; control and cactRNAi (n = 24). (P,Q) Knockdown of Cact significantly increased lamellocyte differentiation. (R) Histogram showing that the number of primary lymph gland lobes with aberrant lamellocyte differentiation was significantly greater when Cact was knocked down. Fisher’s Exact test; P value is as shown; control and cactRNAi (n = 24). Arrows mark lamellocytes (lm). White dotted lines delineate the entire lymph gland; yellow dotted lines delineate the prohemocyte pool. Scale bars: 50 μm. (A-F, J-O) mid-third instar larvae; (G-I, P-R) late-third instar larvae.

