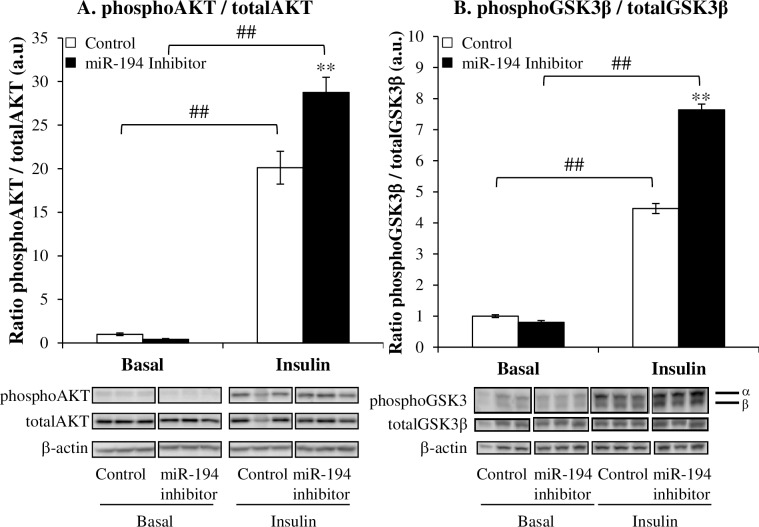
Fig 4. Effect of miR-194 inhibition on AKT and GSK3β expression in L6 cells.
Expression of the phosphorylated and total forms of AKT (A) and GSK3β (B) were measured by Western blot in L6 cells 48 hours after transfection with a miR-194 inhibitor. Ratios phosphorylated:total are expressed as mean ± SEM (n = 3 per group). Representative blots are shown below the graphs. P-values were determined using 2-way ANOVA (normally distributed data) or Kruskal-Wallis 1-way ANOVA on ranks (non-normally distributed data) followed by Student-Newman-Keuls post-hoc tests (* p<0.05 vs. control, # p<0.05 vs. basal).

