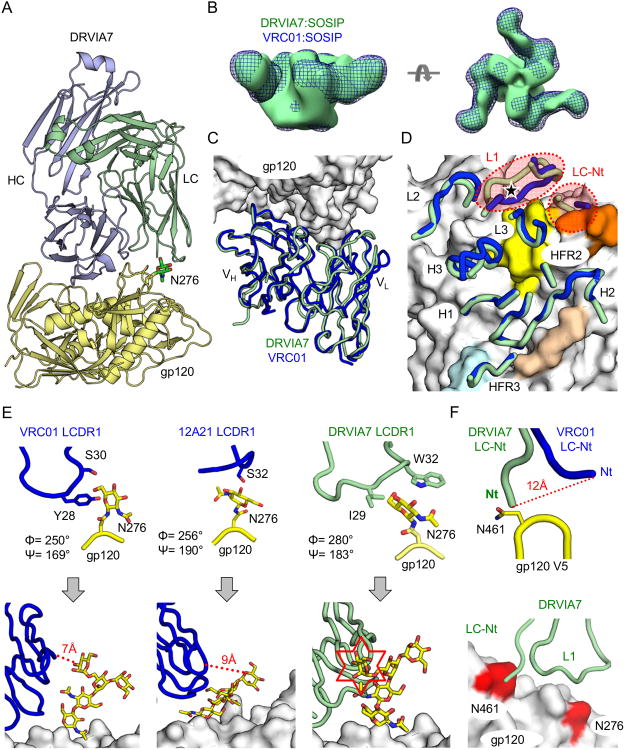
Figure 2. DRVIA7 and VRC01 recognition of gp120 and gp140 differed primarily at light chain interaction with glycans.
(A) Ribbon diagrams of the crystal structure of DRVIA7 Fab (light blue and green) bound to 93TH057 gp120 (yellow) at 3.4 Å resolution are displayed. The N276 glycan is shown in stick-and-ball representation with carbon atoms colored in green, nitrogen atoms colored in blue and oxygen atoms colored in red. (B) Negative-stain EM reconstruction at 21-22 Å of DRVIA7 Fab bound to JRFL SOSIP trimer (green surface) is superposed onto the previously published reconstruction of the BG505 SOSIP trimer bound to VRC01 (blue mesh, EMDB ID: EMDB-6252). (C) Ribbon diagrams of the variable regions of DRVIA7 (green) and VRC01 (blue) are shown after their structures were superposed on gp120 (white molecular surface). (D) The gp120-contacting regions (designated by their CDRs and FR regions) of DRVIA7 and VRC01 are displayed over the molecular surface of gp120 as in (C). The CD4-binding loop on the gp120 surface is colored in beige, the base of the V1/V2 loop in light blue, the V5 loop in orange and the Loop D in yellow. The position of the N276 glycan is indicated by a black star. The light chain CDR1s and N-termini (Nt) display the most structural variance between the two antibodies and are highlighted by red dotted circles. (E) The N276 glycan, from their corresponding gp120 structures, is displayed when bound to VRC01 LCDR1 (blue, left), 12A21 LCDR1 (blue, middle) and DRVIA7 LCDR1 (light green, right). Below, coordinates for Man3GlcNAc2 attached to N276 from a previously published structure (PDBID: 4P9H) are superposed on the protein-proximal GlcNAc visible in the VRC01, 12A21, and DRVIA7 structures. (F) The DRVIA7 and VRC01 light chain N-termini are shown interacting with the gp120 V5 loop. Below, the N276 and V5 loop glycosylation sites are colored in red on the white gp120 surface. Ribbon diagrams of DRVIA7 N-termini and LCDR1 loops are displayed as above. See also Table S2 and Figure S2.

