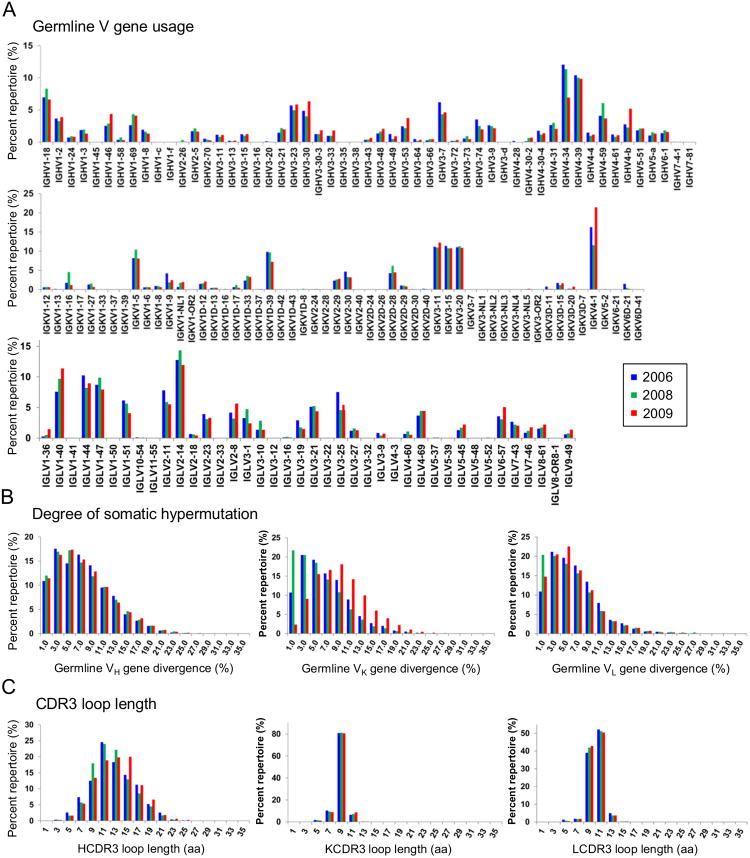
Figure 4. Unbiased B cell repertoire profiles of donor DRVI01 at three time points.
The distribution is plotted for (A) germline V gene usage for heavy and light (κ and λ) chains, (B) germline gene divergence, or degree of SHM, and (C) CDR3 loop length (H – heavy chain; K – κ chain; L – λ chain). Color coding denotes the time point analyzed, with 2006 shown in blue, 2008 in green, and 2009 in red. See also Table S3.

