
Figure 2.
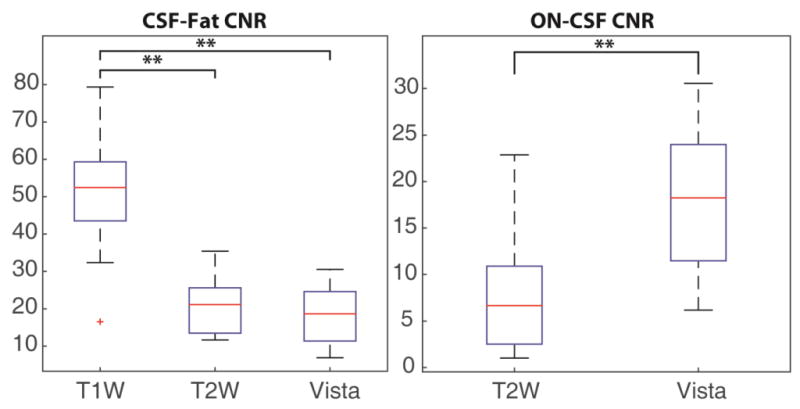
Contrast-to-noise ratio (CNR) comparison for contrast between CSF-Fat (left) and ON-CSF (right) for the clinical standard of care T1W, T2W and the optimized VISTA sequence. ** indicates the results are significantly different by Wilcoxon rank-sum test at p<0.01.