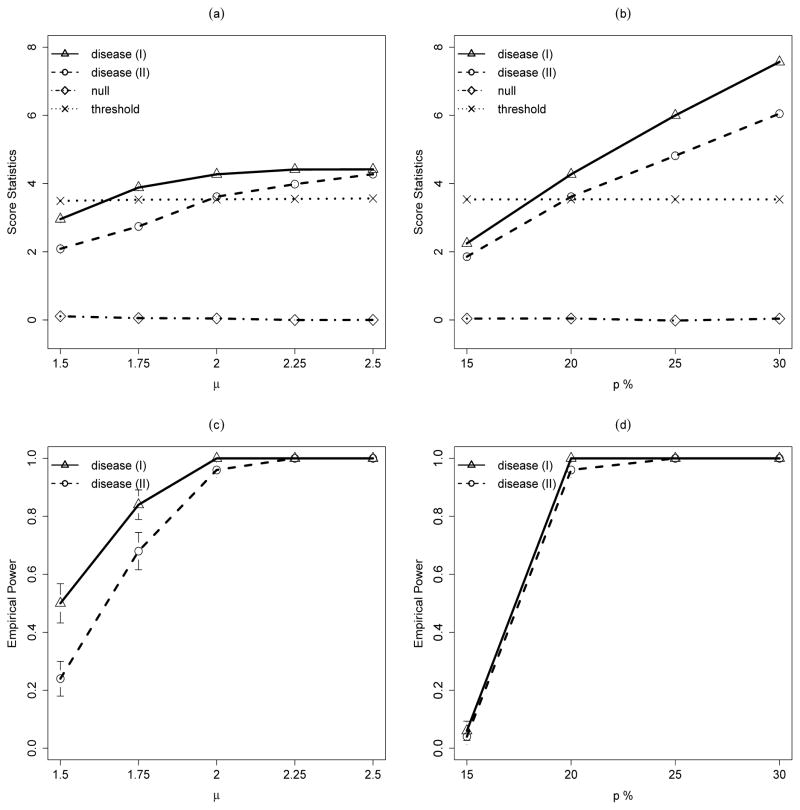
Figure 1.
Simulation results for disease-associated CNV models. Disease (I) assumes that the disease-associated CNVs have the same genomic locations and Disease (II) assumes that the disease-associated CNVs have the variable genomic locations in different samples. (a) and (c): Effect of the CNV jump size μ from 1.5 to 2.25 on (a) score statistics for CNVs with carrier probability of 20% in case and 10% in control and (b) power of detecting the associated CNV. (b) and (d): Effect of the CNV frequency in case p from 15% to 30% on (c) score statistics for CNVs with carrier probability of 20% in case and 10% in control and (d) power of detecting the associated CNV. Each line represents the average of the corresponding statistic over 50 runs. For plots (a) and (b), dotted lines represent the average of the thresholds determined by equation (9) for Disease (I).

