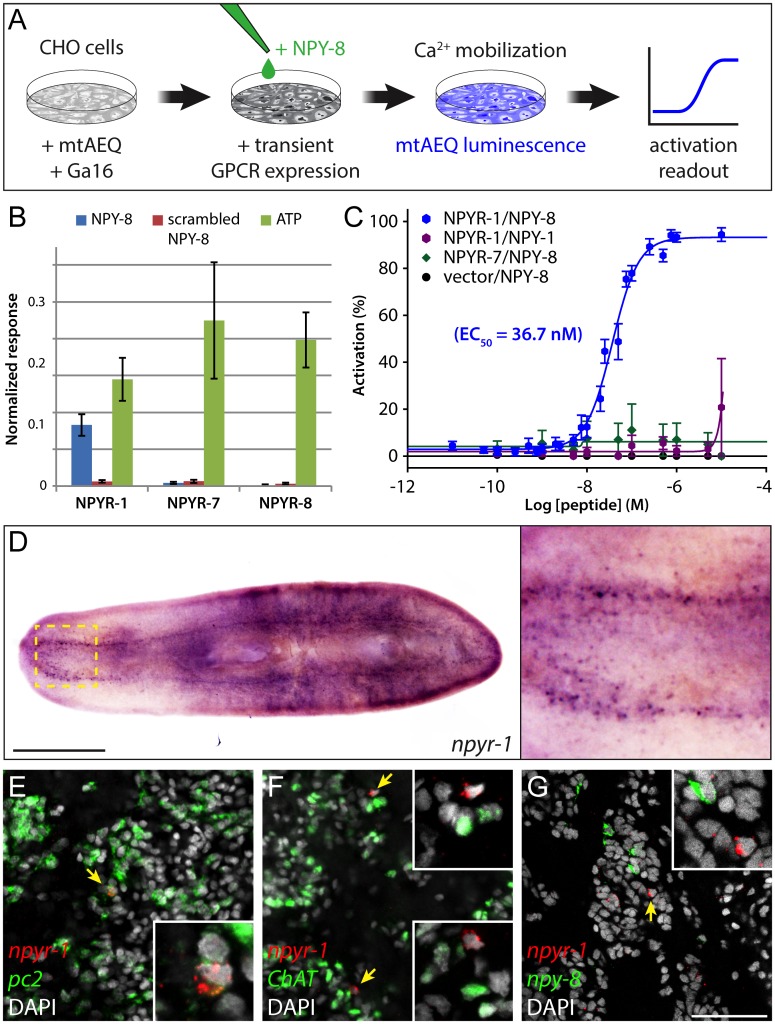
Fig 3. NPY-8 targets npyr-1+ neuroendocrine cells in the CNS.
(A) Schematic of receptor-activation assay performed in CHO/mtAEQ/G16 cells. Candidate GPCRs were expressed transiently in a cell line that enables visualization of calcium mobilization upon receptor activation. (B) Normalized activation response of CHO cells expressing NPYR-1 or control receptors, challenged with NPY-8 or control peptides. NPY-8 specifically activates NPYR-1, while two other NPY receptors (NPYR-7 and NPYR-8) are not activated upon NPY-8 treatment. Scrambled NPY-8 was used as a negative control. Calcium responses were normalized to the total calcium response after addition of 0.1% Triton X-100. ATP, which activates an endogenous CHO receptor, was used to test the functionality of the assay. Peptides and ATP were tested at 10 and 1 μM, respectively. (C) Concentration-response curves for the activation of NPYR-1 by NPY-8 and control peptides. Data are shown as a percentage of the highest normalized response of the concentration series. NPY-8 activates NPYR-1 at EC50 = 36.7 nM (blue). Closely related NPY-1 fails to activate NPYR-1 (purple). Empty pcDNA3.1 vector and NPYR-7 were used as negative controls. Error bars in B and C represent standard error of the mean (SEM) (n ≥ 4). The underlying data for receptor assays can be found in S4 Data. (D) Colorimetric ISH showing expression of npyr-1 in a subset of cells in the brain and along the ventral nerve cords. Inset shows the brain region at higher magnification. (E–G) Double-FISH labeling npyr-1 (red) and other neural markers (green). npyr-1+ cells express neuroendocrine cell marker pc2 (E, 28/30 express pc2) but not the cholinergic neuronal marker ChAT (F, 0/30 express ChAT). npy-8 and npyr-1 are expressed in distinct populations of cells (G, 0/30 npyr-1 cells express npy-8 and 0/30 npy-8 cells express npyr-1). DAPI (grey) labels nuclei. Scale bars are 1 mm in D and 50 μm in E–G.

