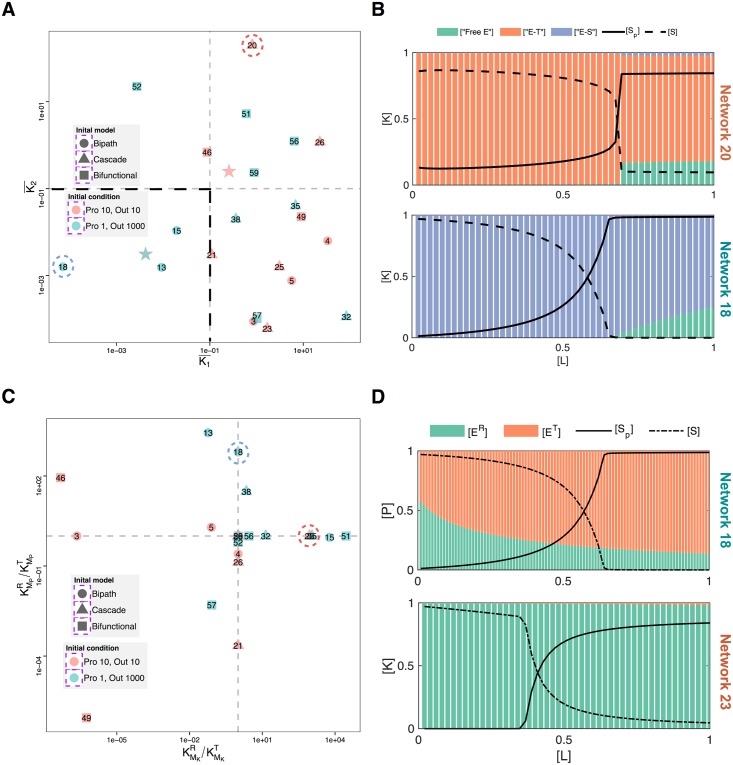
Fig 2. Analysis of evolved ultrasensitive networks.
(A) Average saturation of enzymes in all of the evolved ultrasensitive networks. The average saturation of enzymes is calculated as the geometric mean of individual Michaelis-Menten constants of the different kinases and phosphatases and their allosteric states normalised by the substrate concentration (kinase, K1, or phosphatase, K2). The shape of each data point represents different starting structures to the evolutionary simulations (see S1 Fig). The colours of the data points represent two different evolutionary scenarios; blue: output protein [Stotal] = 1000, other signalling proteins (A*) concentrations [A*total] = 1; red: output protein [Stotal] = 10, other signalling proteins concentrations [A*total] = 10. The blue and red, star-shaped points indicate the average value of the enzyme saturation resulting from these initial concentrations at the start of the evolutionary simulations. Each data point is further labelled with the unique identification number used for each evolutionary simulation. (B) The fraction of different forms of the kinase (y-axis) against the ligand concentration (x-axis) for two different evolved networks (network 20 and 18 in S2 Fig). The fractions of the different forms of the kinase are the substrate-accessible (green), substrate-inaccessible (orange), and substrate-bound (blue) forms. This data is overlaid with the dose-response dynamics; the solid and dashed lines show the steady state concentration of phosphorylated (i.e. response) and unphosphorylated substrate respectively at a given input level. (C) Ratio between KM values of different conformational states (relaxed “R” state and tensioned “T” states) for kinase (x-axis) and phosphatase (y-axis). The colours, shapes and numbers on the dots are the same as in (A). For enzymes without allosteric regulation the ratio are set to one, so that there are no distinctive conformational differences. (D) The fraction of different forms of the phosphatase (top) and kinase (bottom) (y-axis) against the ligand concentration (x-axis) for two different evolved networks (network 18 and 23 in S2 Fig). The different forms of the enzymes are the different conformational states, relaxed “R” state (green) and tensioned “T” state (orange). These are overlaid with dose-response dynamics; the solid and dashed lines show the steady state concentration of phosphorylated (i.e. response) and unphosphorylated substrate respectively.

