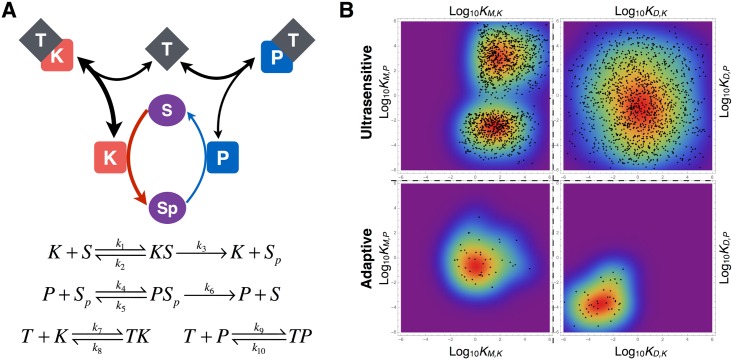
Fig 4. Designed signalling cycle motif and parameter space for adaptation and ultrasensitivity.
(A) Cartoon showing the designed signalling cycle motif with a sequestering protein. The sequestrating protein (T) binds both the kinase (K) and phosphatase (P), which catalyse the phosphorylation and dephosphorylation of unphosphorylated (S) and phosphorylated (Sp) substrate respectively. (B) The values of key parameters for achieving ultrasensitive (> 0.8) and adaptive (>0.3) responses, when assuming an enzyme-saturated regime ([Stotal] = 1, [Ptotal] = 0.1). Panels on the left show the distribution of Michaelis-Menten constants, for kinase: KM,K = (k2+k3)/k1 (x-axis) and phosphatase KM,P = (k5+k6)/k4 (y-axis). Panels on the right show the distribution of affinities of sequestrating protein T with kinase and phosphatase: KD,K = k8/k7 and KD,P = k10/k9 Note that all four panels are plotted on the same logarithmic range. Each black dot represents a parameter set and the colours shows density of parameters.

