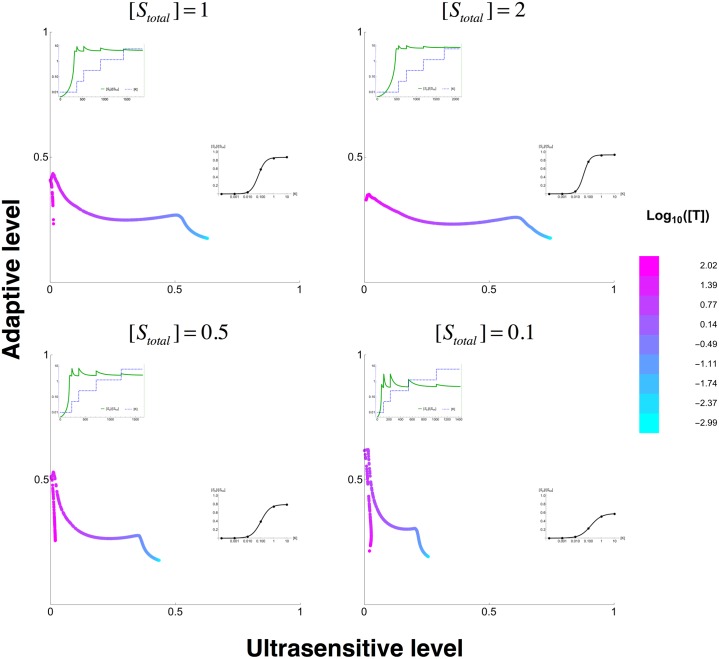
Fig 5. Modulation of response dynamics through tuning of scaffold protein concentration.
The four panels show sampling the total concentration of scaffolding protein, [Ttotal], when fixing all other parameters and with the total concentration of substrate [Stotal] as shown on the panels. The colour of each data point represents the concentration of the scaffolding protein concentration. In each panel, the best ultrasensitive or adaptive response dynamics that are achieved at a specific [Ttotal] level are shown as insets. For adaptive responses (top left of each panel), the inset shows the concentration of the input ([K]) as a blue dashed line and the concentration of the output ([Sp]) as a solid green line. For ultrasensitive dynamics (bottom right of each panel), the inset shows the steady state fraction of phosphorylated substrate ([Sp]/[Stot]) at a given input level ([K]) as a black solid line.

