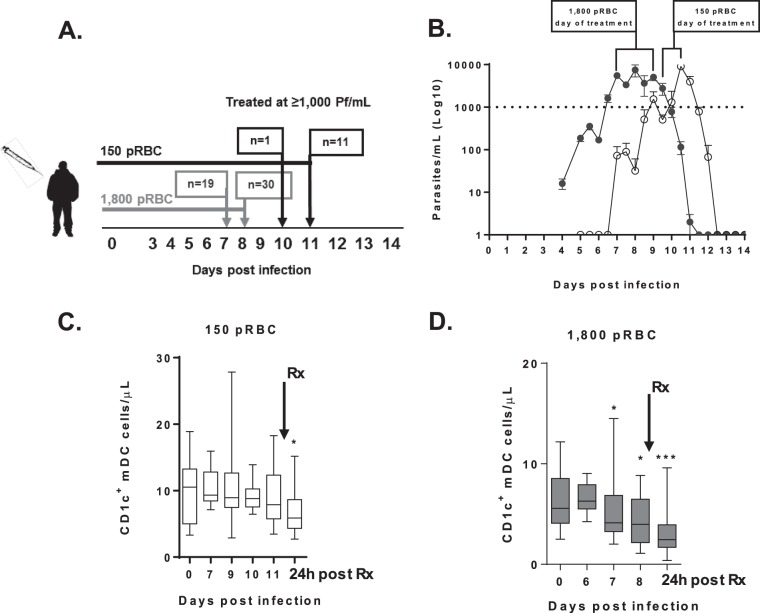
FIG 1.
Parasitemia and CD1c+ mDC absolute counts in participants infected with 150 pRBCs (white) or 1,800 pRBCs (gray). (A) Schematic of clinical trial cohorts, 150 pRBCs (black) and 1,800 pRBCs (gray). On the days specified, PCR, full blood counts, and immunological assays were performed. Arrows indicate the day of antimalarial treatment, and “n” represents the number of volunteers treated. (B) Parasitemia was determined by qPCR in participants infected with 150 pRBCs (white circles) or 1,800 pRBCs (gray circles). The dotted line indicates the predetermined parasite treatment threshold of 1,000 parasites/ml. Brackets represent the day of antimalarial treatment after infection with 1,800 pRBCs on day 7 (n = 19), day 8 (n = 30), or day 9 (n = 1) or with 150 pRBCs on day 10 (n = 1) or day 11 (n = 11). The mean parasitemia ± the standard error is presented. (C) Absolute number of circulating CD1c+ mDCs after 150-pRBC infection in 12 participants (24 h after drug treatment, P = 0.04; the exception being six individuals on days 7 and 10). (D) Absolute number of circulating CD1c+ mDCs after 1,800-pRBC infection in 21 participants (day 7, P = 0.05; day 8, P = 0.04; 24 h after drug treatment, P = 0.0002; the exception being 7 individuals on day 6 and 14 individuals on day 8 and after antimalarial drug treatment [Rx]). The box plot shows the minimum, maximum, median, and interquartile range for the data from all of the subjects.

