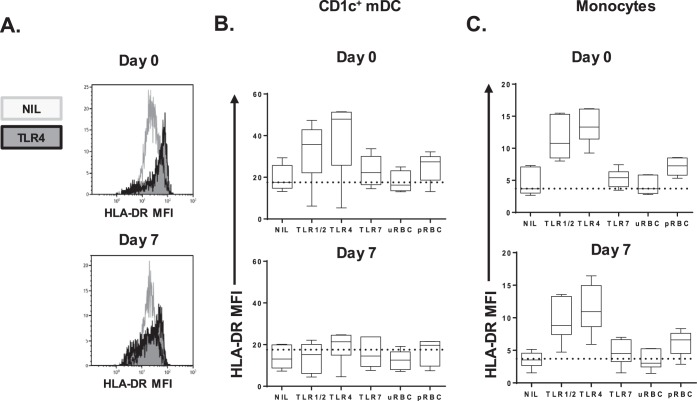
FIG 3.
CD1c+ mDC HLA-DR expression after TLR or pRBC stimulation. (A) Representative histograms of HLA-DR MFI on whole-blood CD1c+ mDCs in one individual on days 0 and 7. (B) CD1c+ mDC HLA-DR expression in six participants on day 0 (top graph) and day 7 (bottom graph). The dotted line shows the median HLA-DR MFI on day 0 for the control (NIL) condition (median = 17.6). (C) Monocyte HLA-DR expression in six participants on day 0 (top graph) and day 7 (bottom graph). The dotted line shows the median HLA-DR MFI on day 0 for the control (NIL) condition (median = 4). MFI, median fluorescence intensity; uRBC, uninfected red blood cells; pRBC, parasitized red blood cells.

