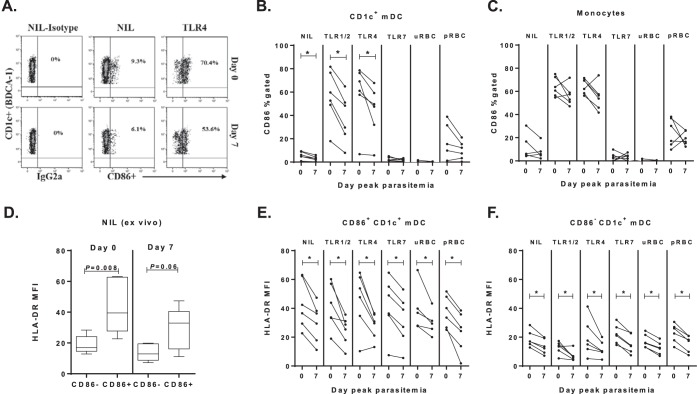
FIG 4.
CD1c+ mDC CD86 expression at peak parasitemia. (A) Representative gating strategy for CD86 on whole-blood CD1c+ mDCs in one individual on day 0 and day 7. (B) The paired frequency of CD86+ CD1c+ mDCs in six participants at day 0 (baseline) and day 7 (peak-parasitemia). The ex vivo (NIL), post-TLR, and uRBC or pRBC stimulation data are shown.(C) The paired frequency of CD86+ CD14+ monocytes in six participants day 0 (baseline) compared to day 7 (peak parasitemia). (D) HLA-DR expression on CD86+ compared to CD86− CD1c+ mDCs at day 0 (baseline) and day 7 (peak parasitemia). A Mann-Whitney test was used for comparison between cell subsets. (E) HLA-DR expression on CD86+ CD1c+ mDCs at day 0 (baseline) and day 7 (peak parasitemia) in six participants. (F) HLA-DR expression on CD86− CD1c+ mDCs at day 0 (baseline) and day 7 (peak parasitemia) in six participants. A Wilcoxon matched-paired test was used for comparison between day 0 and day 7. *, P = 0.03.

