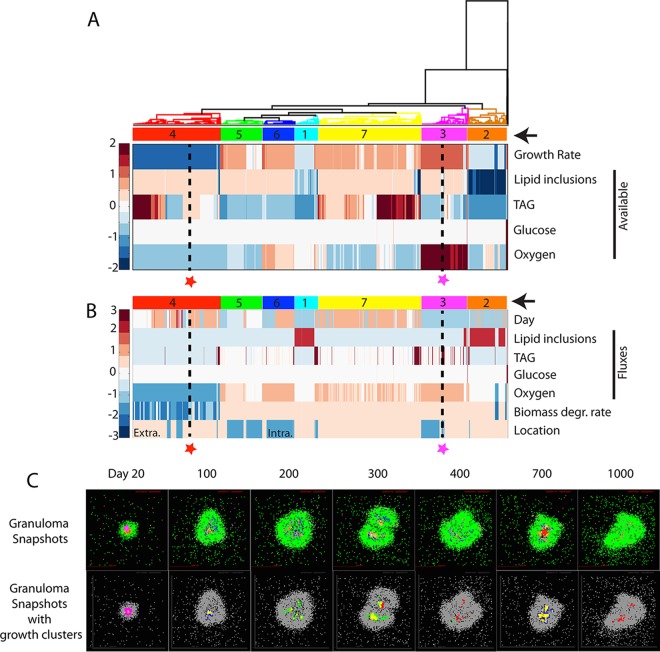
FIG 5.
Hierarchical clustering of bacteria by nutrient conditions and spatial location. (A) Bacteria (columns) from multiple time points from a representative granuloma are hierarchically clustered based on growth rate and level of lipid inclusions, TAG, glucose, and oxygen available in each bacterium's immediate environment (rows). Data for each nutrient are standardized to the row average. Clusters are numbered and highlighted with color codes indicated by arrows on the right. Two bacteria are highlighted (red and magenta stars with black dashed lines) as examples discussed in the text. These two bacteria are also used as examples in the discussion of panels B and C. (B) Bacterial clusters from panel A are further characterized by plotting their time points (day), fluxes from the CBM (i.e., optimal uptake fluxes for each nutrient calculated by the CBM based on the available nutrients), biomass degradation rate, and cellular location. Values for each output are standardized by row values. Extra., extracellular; Intra., intracellular. (C) Bacteria and their growth clusters are localized within granulomas. Granuloma simulation snapshots are shown in the top row with agent colors corresponding to those in Fig. 3D. The example bacteria from panels A and B are located in these granuloma snapshots with stars in the panels for 20 dpi and 700 dpi. Bacterial growth clusters are shown in the granulomas (bottom row) using color codes of clusters from panels A and B.

