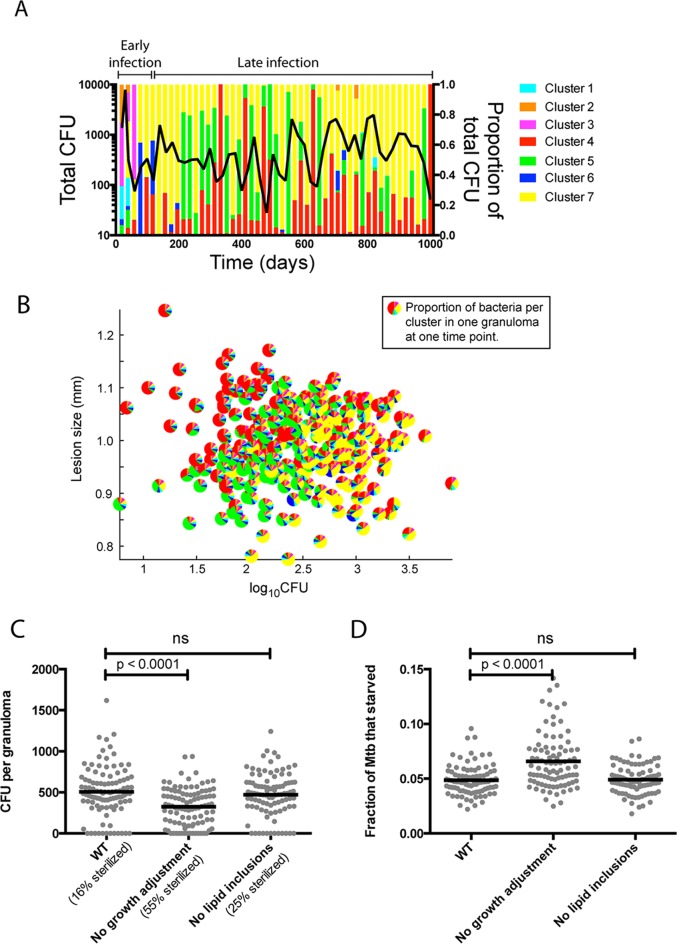
FIG 6.
Importance of growth adaptation for long-term survival of M. tuberculosis in granulomas. (A) Proportions of bacteria in each growth cluster (the 7 clusters identified in Fig. 5) were quantified every 20 days over the course of infection (right y axis) and plotted with total CFU (left y axis). (B) Each pie symbol represents 1 granuloma (data represent 300 granulomas randomly selected from a collection of 100 granulomas sampled at different time points after 200 dpi). Slices represent proportions of bacterial populations within each growth cluster. (C and D) Comparisons of WT simulations to simulations in which growth adaptation or the ability to accumulate lipid inclusions was removed. (C) Time-averaged CFU between 200 and 1,000 dpi. (D) Fraction of bacteria that died from starvation by 1,000 dpi (i.e., biomass < τdeath) for individual granulomas (n = 100). P values indicate results from the Kruskall-Wallis test with Dunn's correction for multiple comparisons. Lines show means. ns, not significant.

