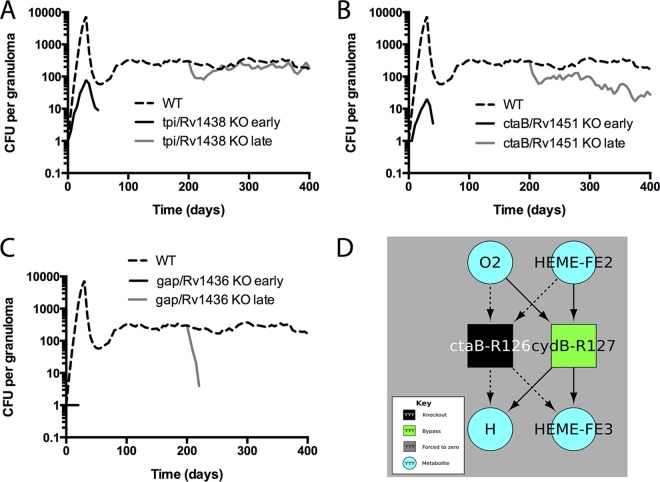
FIG 7.
Bacterial loads over time for different virtual KO mutants. Data represent predicted total CFU (median) over time for the WT (dashed line), knockouts from the start of infection (black line), or mid-infection knockouts from 200 dpi (gray line). Data from three representative gene products are shown. (A) tpi/Rv1438, a triosephosphate isomerase which has a role in glycolysis. (B) ctaB/Rv1451, a cytochrome c oxidase assembly factor. (C) gap/Rv1436, a probable GAPDH (glyceraldehyde 3-phosphate dehydrogenase) involved in the second phase of glycolysis. n = 20 for the knockouts; n = 100 for the WT. (D) Bypass reactions identified by flux variability analysis (FVA). Squares represent chemical reactions corresponding to the enzyme label. Metabolites used or produced by any of the depicted reactions are included (teal circles). This diagram shows the reactions eliminated by a gene knockout (black square) and reactions that became “required” (defined as leading to attenuation if removed) in the knockout but that were not required in the WT (green square). Dashed arrows correspond to metabolite usage or production no longer present in the knockout (as the reaction has been removed); solid arrows correspond to reactants of the bypass (green) reactions. To summarize what can be gleaned from this figure, the protein encoded by ctaB is required for cytochrome bc1 oxidase activity. Thus, a knockout mutant in ctaB makes use of a bypass flux through cydB, which is part of the less efficient cytochrome bd complex. Under conditions in which cydB was also knocked out (or severely inhibited by drugs), the model predicts that M. tuberculosis would be further attenuated in growth (though not necessarily incapable of growth). Identical results were obtained for knockouts in any of the following genes annotated as required for cytochrome c oxidase activity: ctaB, ctaC, ctaD, ctaE, fixA, fixB, qcrA, qcrB, qcrC, and Rv1456c.

