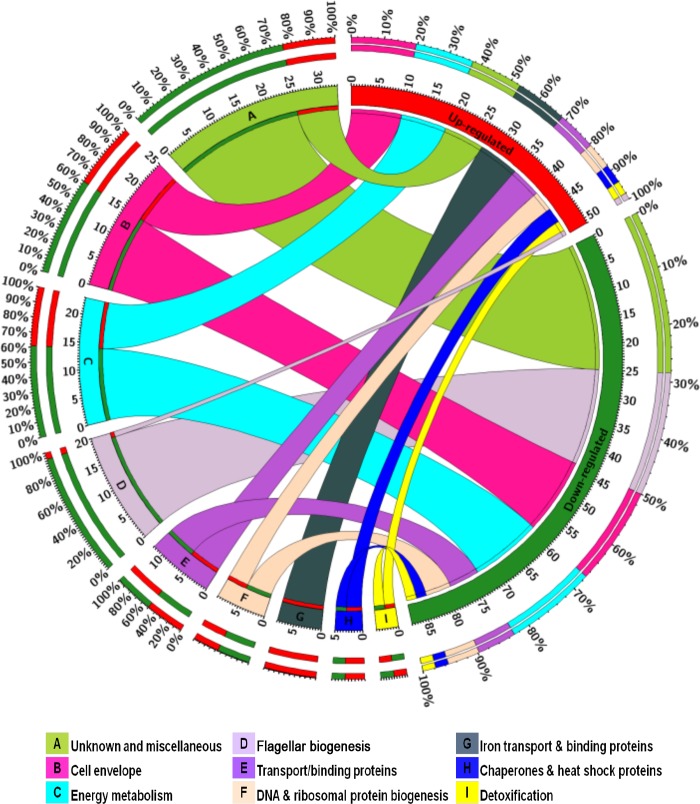
FIG 3.
Functional categorization of Fur- and acid-responsive genes. The total numbers of up- and downregulated genes are represented in red and green segments, respectively. Colored segments labeled A to I represent each functional category, and the ribbon size indicates the number of genes within each category that are either up- or downregulated. The outermost colored segments represent the relative contribution of each functional category to the total number of up- and downregulated genes. The figure was constructed using Circos Table Viewer (46).

