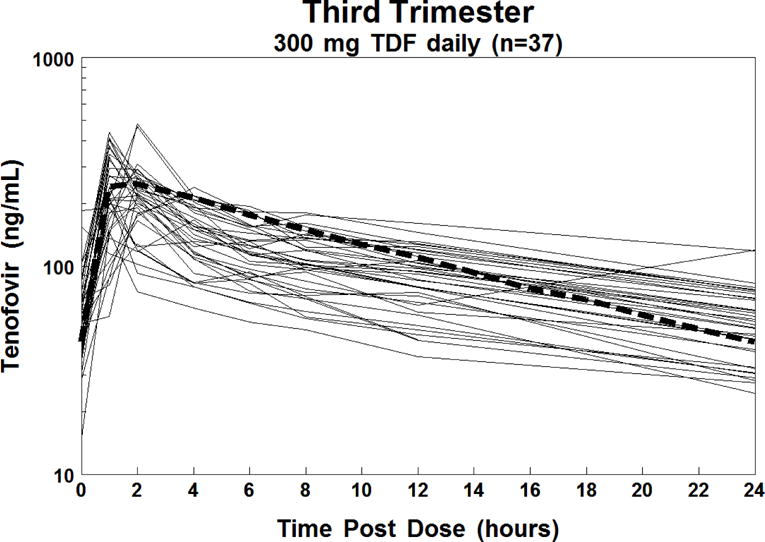
Figure 1.

Individual plasma concentration-time curves of tenofovir in 37 HIV-1 infected pregnant women in the 3rd trimester (solid lines) and the estimated 50th percentile concentration-time curve for non-pregnant HIV-infected historical adult controls (thick dashed line).
