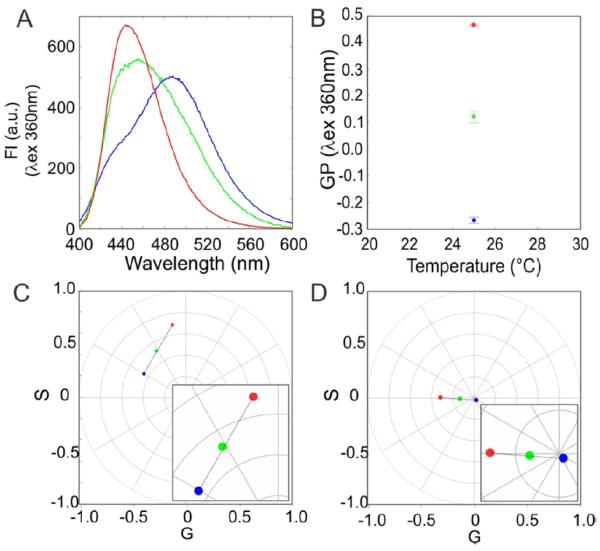
Figure 2.
Example of the identification of linear combination in the emission of LAURDAN in a binary mixture of fluid and gel membrane with spectral phasor. (a) Spectra recorded of the MLVs of DOPC (blue), DPPC (red) and a mixture 1:1 mol of DOPC:DPPC (green) at 25 °C. (b) Calculated GP values from the spectral intensity (GP = I440 − I490/I440 + I490). (c) Spectral phasor position of each sample in the first harmonic. (d) Spectral phasor position of each sample in the second harmonic. All the measurements were done in triplicate and each point represents the mean ± standard deviation (when standard deviations do not appear they are smaller than the symbol diameter).

