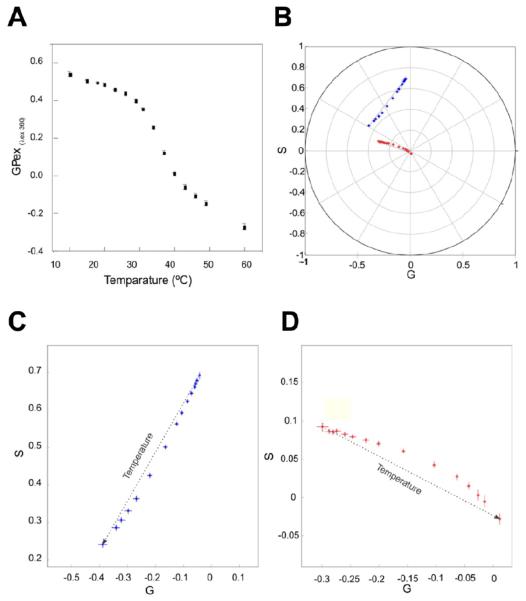
Figure 4.
Study of the thermotropic behavior of porcine native pulmonary surfactant with LAURDAN. (a) Excitation GP (excitation wavelength was 360 nm) for the thermotropic transition of pulmonary surfactant from 15 to 70 °C (each step was 5 °C). (b) First and second harmonic (blue and red, respectively) spectral phasor plot for the LAURDAN in the pulmonary surfactant during the thermotropic transition. (c), (d) Zoom of the first and second harmonics in plot B, the temperature increase is denoted by the arrow direction. All the measurements were done in triplicate and each point represents the mean ± standard deviation (when standard deviations do not appear they are smaller than the symbol diameter).

