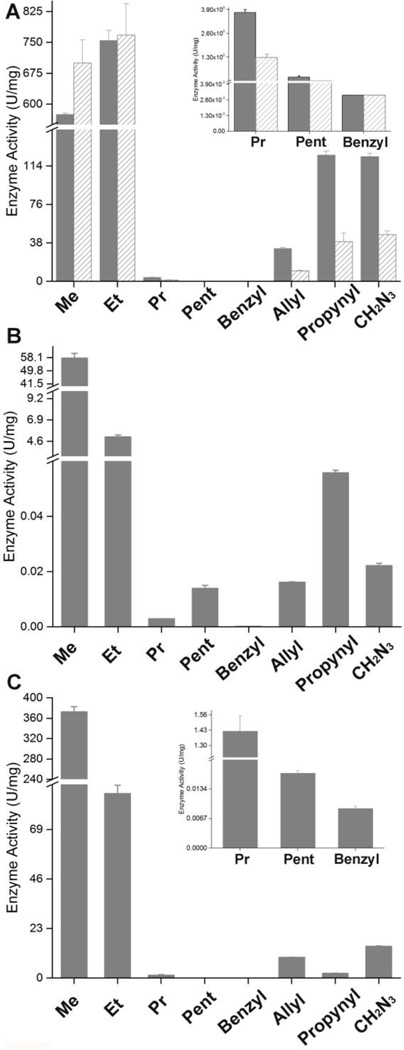
Figure 3.
Enzyme SA toward HACoA analogs 1a–1h at 1.6 mM. (A) wt- (solid bar) and A479S-PhaCCs (patterned bar). The enzyme concentrations are (wt/A479S) 2.0/2.4 nM, 2.0/2.4 nM, 234/285 nM, 703/854 nM, 703/854 nM, 47/57 nM, 7.8/9.5 nM, and 7.8/9.5 nM for HBCoA (Me), HVCoA (Et), HHxCoA (Pr), HCCoA (pent), HPBCoA (benzyl), HHxeCoA (allyl), HHxyCoA (propynyl), and HABCoA (CH2N3), respectively. (B) PhaCCc. The enzyme concentrations are 81.5 nM, 2.17 µM, 65.21 µM, 32.60 µM, 32.60 µM, 32.60 µM, 32.60 µM, and 32.60 µM for HBCoA, HVCoA, HHxCoA, HCCoA, HPBCoA, HHxeCoA, HHxyCoA, and HABCoA, respectively. (C) PhaECAv. The enzyme concentrations are 5.1 nM, 12.7 nM, 509 nM, 10.17 µM, 10.17 µM, 63.6 nM, 254 nM, 50.9 nM for HBCoA, HVCoA, HHxCoA, HCCoA, HPBCoA, HHxeCoA, HHxyCoA, and HABCoA, respectively.

