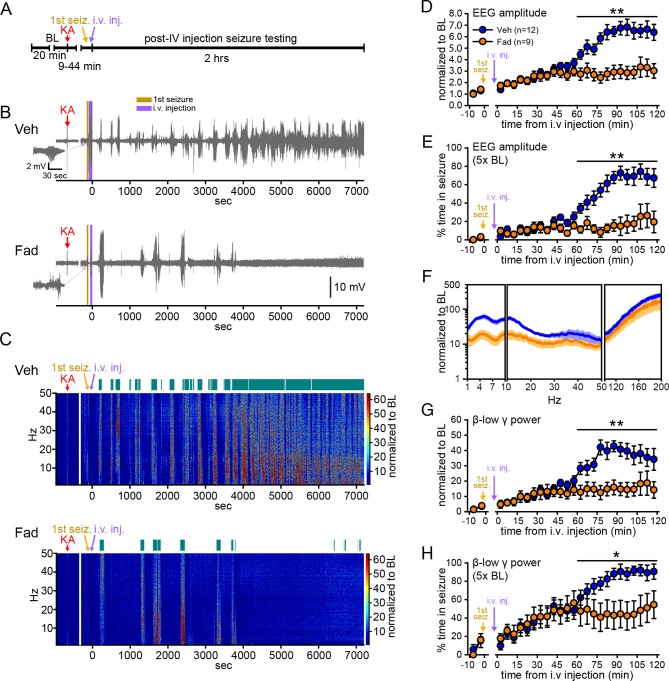
Figure 1. Systemic inhibition of aromatase after seizure onset suppresses electrographic seizures in gonadectomized rats.
(A) Schematic of experimental design. (B, C) Representative EEG (B) and normalized power spectrum (C) from one vehicle (Veh, top)- and one fadrozole (Fad, bottom)-treated rat. For EEG, the 1st seizure in each animal is shown on the left. Teal bars above heatmaps indicate seizures detected by 5x baseline power in the β-low γ (10–50 Hz) range as the threshold. (D) Mean ± SEM normalized EEG amplitude plotted in 5 min bins for vehicle (blue, n=12)- and fadrozole (orange, n=9)-treated rats. The escalation of seizures evident in vehicle-treated rats during the 2nd hr of testing was inhibited by fadrozole. (E) Mean ± SEM percent time in seizure using 5x baseline thresholds of EEG amplitude showing that the progressive increase in time in seizure evident in vehicle-treated rats was also inhibited by fadrozole. (F) Mean ± SEM normalized power spectrogram plotted in 1 Hz bins for δ-θ (1–10 Hz), β-low γ (10–50 Hz), and ripple (100–200 Hz) frequency ranges for vehicle (blue) and fadrozole (orange) rats showing the KA-induced increase in power relative to baseline for each frequency range examined. Increases in δ-θ (p<0.001, ANOVA) and β-low γ (p=0.01, ANOVA) power were lower in fadrozole- than vehicle-treated rats. (G) Mean ± SEM normalized EEG β-low γ power plotted in 5 min bins for vehicle (blue) and fadrozole (orange) rats showing the lack of seizure escalation in fadrozole-treated rats. (H) Mean ± SEM percent time in seizure plotted in 5 min bins using 5x baseline thresholds of β-low γ power for vehicle (blue) and fadrozole (orange) rats also showing the lack of seizure escalation in fadrozole-treated rats. *p<0.05 and **p<0.01 between vehicle- and fadrozole-treated rats, post-hoc unpaired t-tests. BL = baseline.


