
Figure 4. Hippocampal neurosteroid E2 levels increase during KA seizures.
(A) Mean ± SEM percent baseline (BL) E2 before and after KA showing that KA-induced seizures increased hippocampal E2 concentration (**p<0.001 relative to BL, post-hoc paired t-tests). (B-D) Time in Racine 1–5 seizures (left) was used to classify rats into those experiencing mild (<30 min, B), moderate (30–90 min, C), or severe (>90 min, D) seizures, and E2 levels (right) were measured before and after KA. Rats with mild seizures (B) showed a small delayed increase in hippocampal E2, whereas rats with moderate seizures (C) showed a large (x3 BL) increase within 30 min (*p<0.05, **<0.01 relative to BL, paired post-hoc t-tests). E2 levels did not change in rats with the most severe seizures (D). (E) Mean ± SEM E2 concentrations during baseline (BL) and after KA injection (KA) for rats with mild/moderate vs. severe seizures shows that basal E2 was significantly higher in rats in which KA produced severe seizures (*p<0.05, t-test), whereas E2 increased from low to high levels in rats in which KA produced mild/moderate seizures (*p<0.05, t-test).
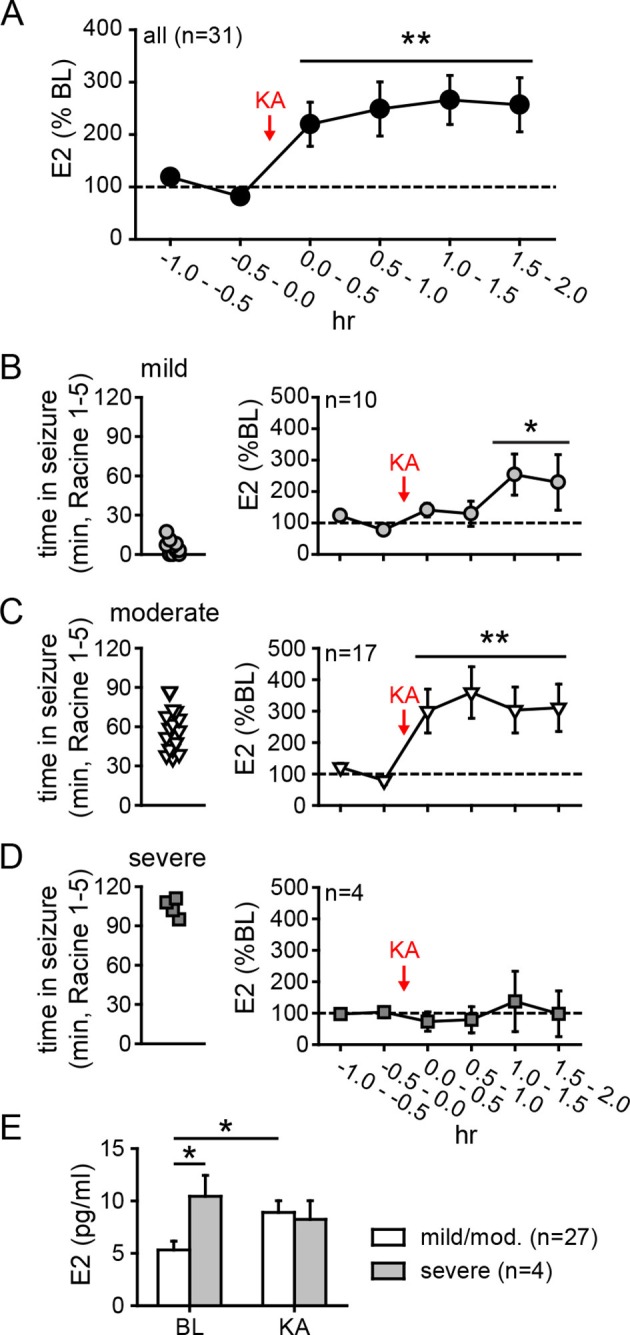
Figure 4—figure supplement 1. Placements of microdialysis probes.
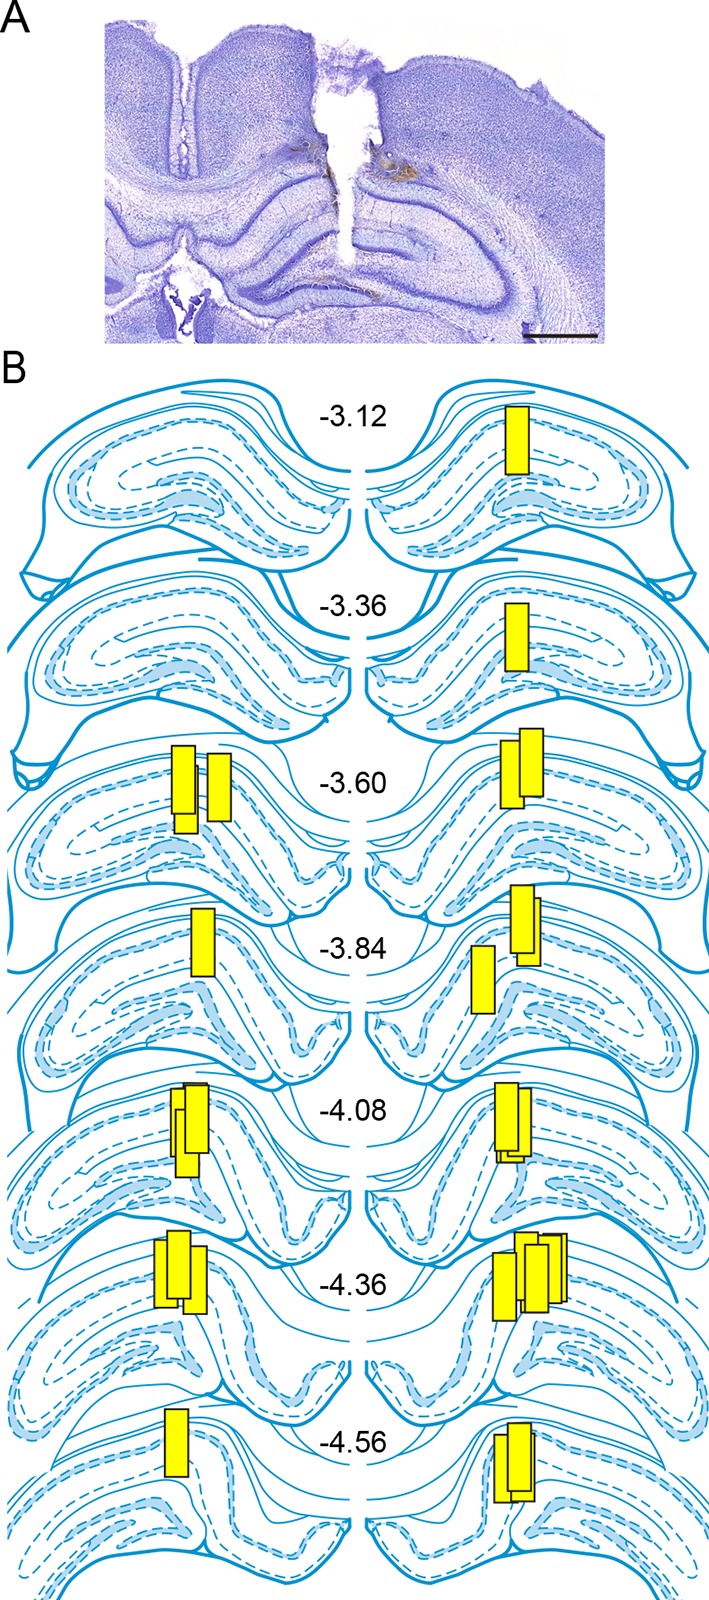
Figure 4—figure supplement 2. No difference in seizure-induced changes in hippocampal E2 by sex or hemisphere.
