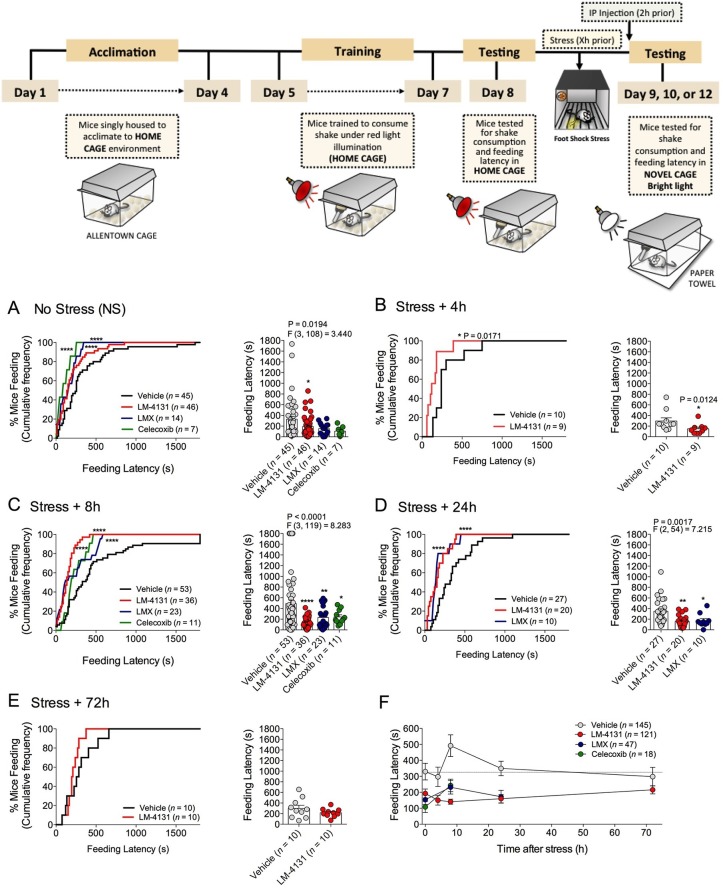
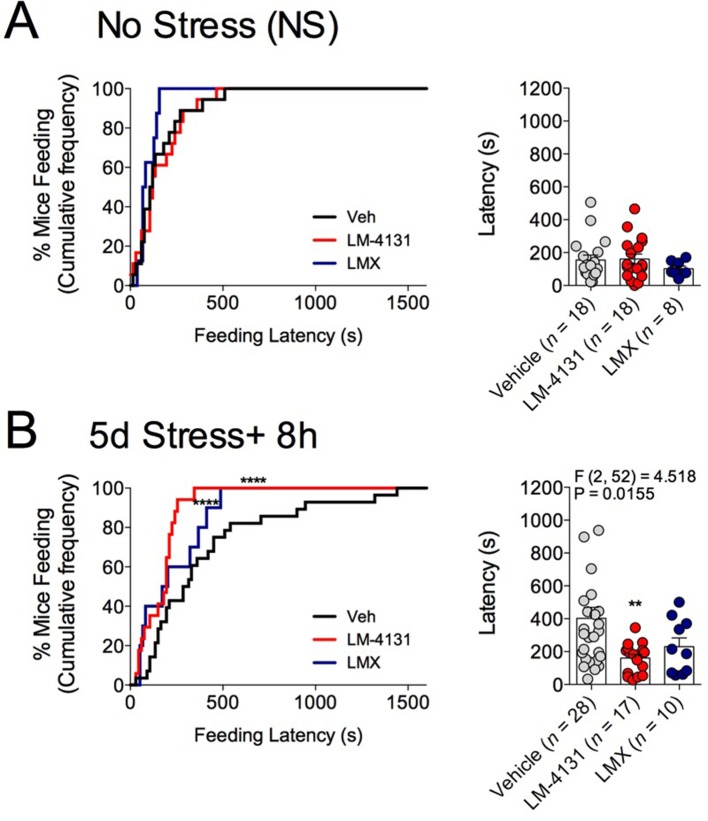
Figure 1. Effects of COX-2 inhibition in the NIH assay.
Effects of vehicle, LM-4131, Lumiracoxib, and Celecoxib administered 2 hr prior to behavioral testing on feeding latency under non-stressed (control conditions) (A), and 4 hr (B), 8 hr (C), 24 hr (D), and 72 hr (E) after foot-shock stress (experimental design shown above). Cumulative distribution curves depict percentage of mice feeding at each latency time point (sec), while bar graphs represent mean ± S.E.M feeding latency for each group and individual data points. Each point represents 1 mouse. (F) Re-plotted data from A-E in time-course format depicting effects of drugs on feeding latency over time. Significant F and P values from one-way ANOVA noted above bar graphs; *p<0.05, **p<0.01, ****p<0.0001 by Holm-Sidak post hoc multiple comparisons test in bar graphs. For cumulative frequency distributions, *p<0.05, ****p<0.0001 by K-S test.
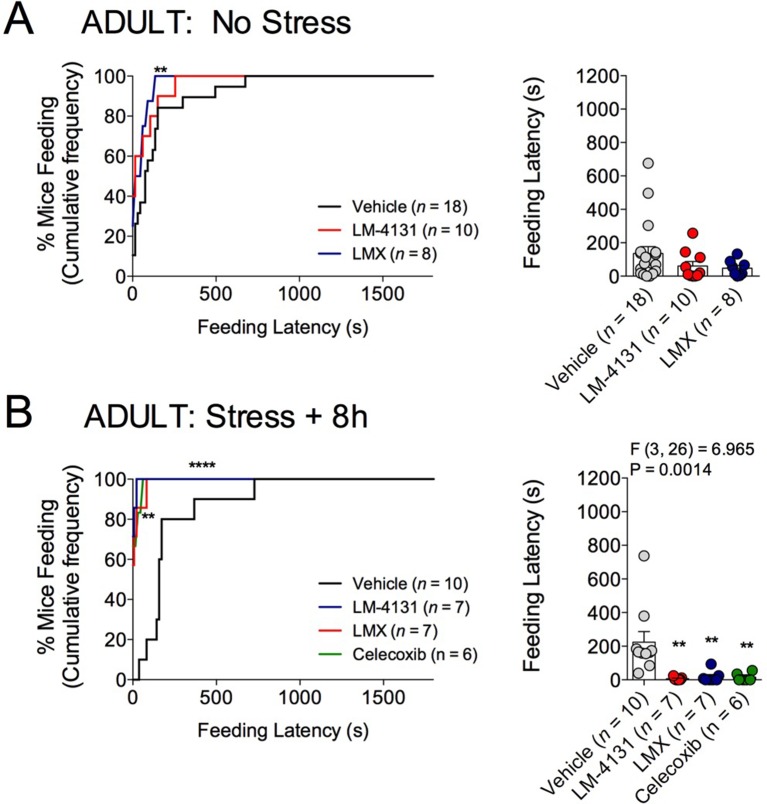
Figure 1—figure supplement 1. Effects of COX-2 inhibition on feeding latency in the NIH assay in 4-month-old male mice.
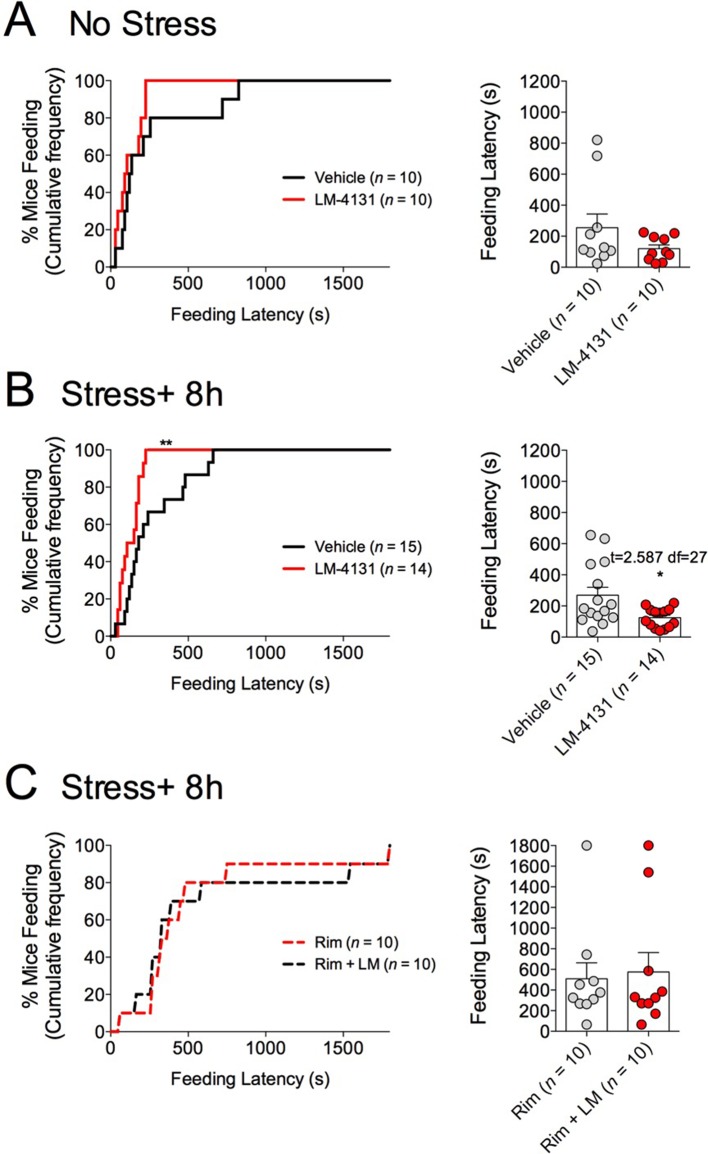
Figure 1—figure supplement 2. Effects of COX-2 inhibition on feeding latency in the NIH test in female mice.
Figure 1—figure supplement 3. Effects of COX-2 inhibition on feeding latency in the NIH test after sub-chronic stress.
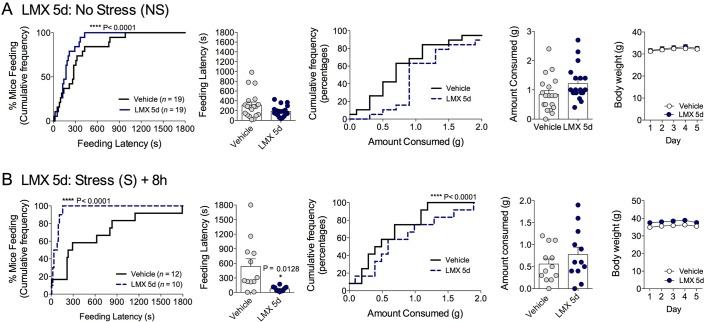
Figure 1—figure supplement 4. Effects of subchronic COX-2 inhibition on feeding latency in the NIH test.
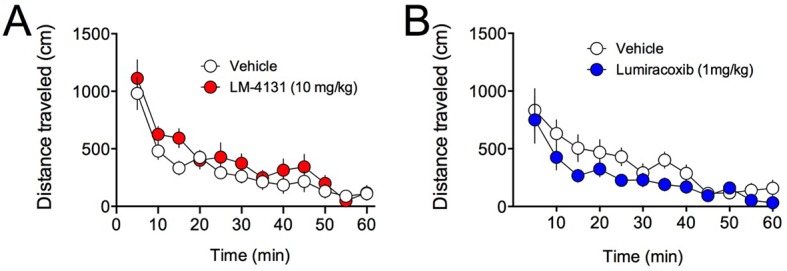
Figure 1—figure supplement 5. Effects of COX-2 inhibition on locomotor activity in the open field test.
