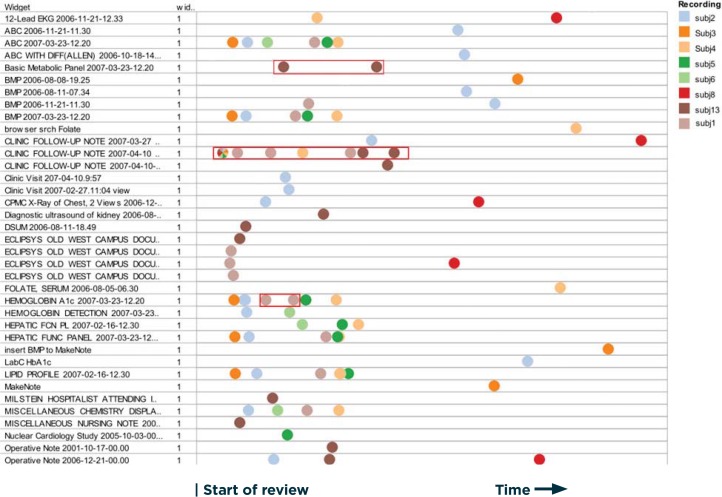
Figure 3.
Partial Swim Lane Representation of Users’ Paths Through the EHR For Case 2
Notes: The horizontal axis is time; the vertical axis is list of elements. Each color represents one subject. Each dot represents one view of that information element. By following dots of one color we can see the sequence of what that user viewed. If two dots of the same color appear in the same row, it means that user re-viewed the same information twice. Examples are outlined in red. Subjects 1 and 13 repeated viewing the same element (particularly the index note, Clinic Follow-up Note 2007-04-10).

