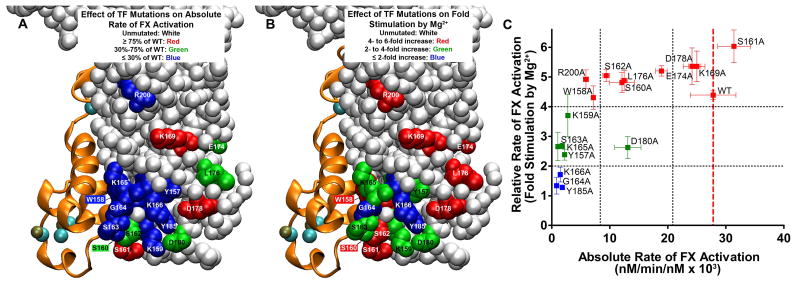
Figure 5.
Localization and properties of TF residues investigated. The structure is from Protein Data Bank entry 3TH2, in which sTF/FVIIa was crystallized in the presence of 5 mM Ca2+ and 2.5 mM Mg2+.1 FVIIa is depicted as orange ribbons, with bound Ca2+ ions colored teal and Mg2+ ions beige. (A) Localization of the TF residues tested in this study for their effect on the absolute rate of FX activation by memTF/FVIIa in solution. TF residues are color-coded according to their rate of FX activation in the presence of 1.85 mM Ca2+ alone (from Figure 2A). Unmutated TF residues are colored white. TF residues are colored red, which, when mutated, retained essentially WT activity (i.e., ≥ 75% of the WT rate of FX activation). Residues with a moderate effect on the FX activation rate are colored green (30-75% of the WT rate); residues with severe defects are colored blue (≤ 30% of the WT rate). Residues W158 and S160, obstructed in this view, are colored blue and green, respectively. (B) Localization of TF residues tested in this study as being important for the ability of Mg2+ to enhance the rate of FX activation by memTF/FVIIa in solution. TF residues are color-coded according to their rate of FX activation in the presence of Ca2+ and Mg2+ normalized to the rate at 1.85 mM Ca2+ alone (from Figure 2B). Unmutated TF residues are colored white. TF residues are colored red, which, when mutated, retained essentially WT responses to Mg2+ (i.e., 4-6-fold enhancement of the FX activation rate). Residues with blunted responses to Mg2+ are colored green (2-4-fold enhancement by Mg2+) or blue (1-2-fold enhancement by Mg2+). Residues W158 and S160, obstructed in this view are colored red. (C) Relative rate of FX activation (rate with 1.25 mM Ca2+ and 0.6 mM Mg2+, divided by the rate with 1.85 mM Ca2+) vs the absolute rate of FX activation, in both cases by memTF/FVIIa in solution (i.e., data replotted from panels A and B of Figure 2, respectively). Residues are color-coded as in panel B. Vertical black dotted lines correspond to the color-coding cutoff values from panel A; horizontal black dotted lines correspond to the color-coding cutoff values from panel B. A vertical dashed red line marks the location of WT TF.

