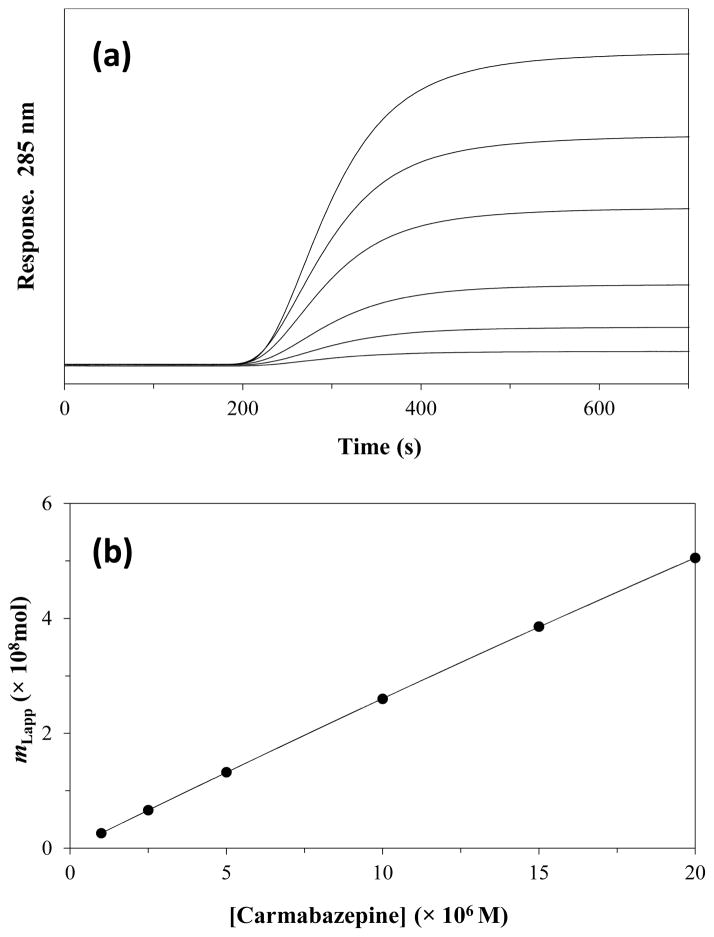
Figure 3.
(a) Typical chromatograms obtained during frontal analysis at 0.50 mL/min using the application of carbamazepine to a 1.0 cm × 2.1 mm i.d. entrapped AGP column at pH 7.4 and 37 °C, and (b) fit of the frontal analysis data for carbamazepine on the entrapped AGP column to a two-site model. The concentrations of applied carbamazepine in (a) were (from top to bottom) 20, 15, 10, 5, 2.5, and 1 μM, respectively. The support used in the AGP column had a pore size of 100 Å. The best-fit line in (b) was obtained by using Eqn. (2) and fixed values for Ka2 and mL2, as based on results that were obtained for carbamazepine on the control column. The correlation coefficient for the fit shown in (b) was 0.9999 (n = 6).

