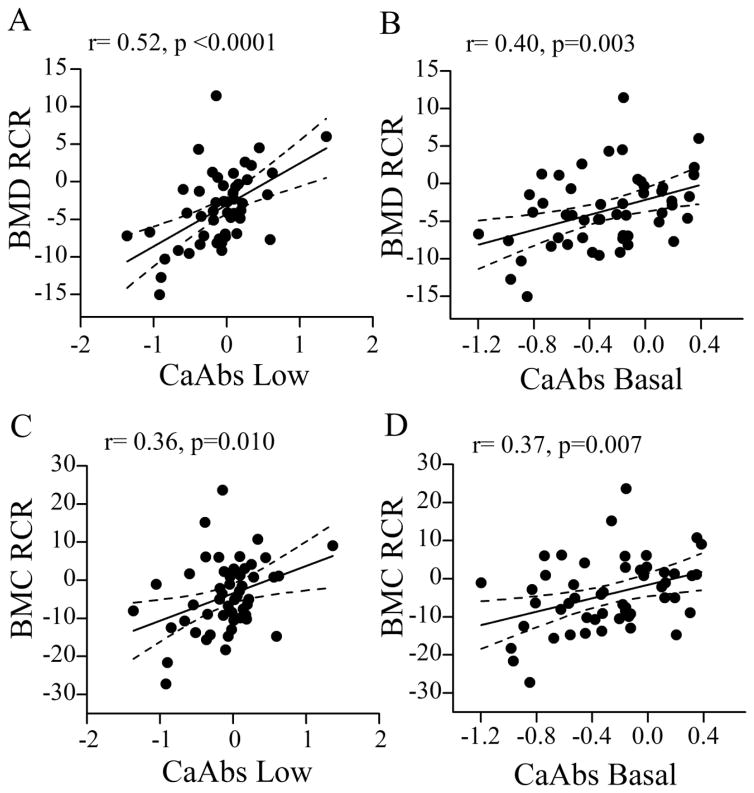
Figure 1. Correlation between bone responses to Ca restriction and Ca absorption efficiency.
(A) BMC response to Ca restriction (RCR) vs. Ca absorption efficiency (CaAbs) on the Low (0.25%) (B) and basal (0.5%) Ca diets. (C) BMD RCR vs. CaAbs efficiency on the Low (D) and Basal Ca diets. ANCOVA line means with 95% confidence intervals are shown (n=51). CaAbs data was log transformed. Pearson’s correlation coefficient (r) and p values are shown.

