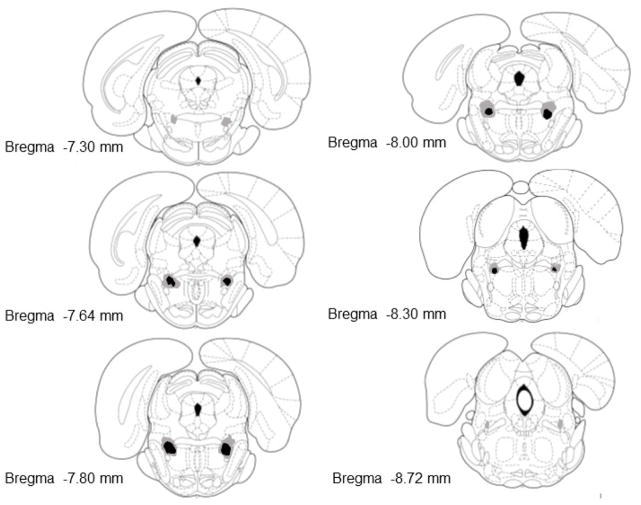
Figure 2.
Representation of lesion damage in rats classified as having bilateral PPTg lesions. Numbers in the bottom left of each section indicate the distance that each section is from bregma (mm). The black shaded areas represents the minimum extent of neuronal loss for all bilaterally lesioned rats. The surrounding grey areas represents the maximum extent of neuronal loss in the bilateral lesion group. Sections were adapted from those in Paxinos & Watson (1998).

