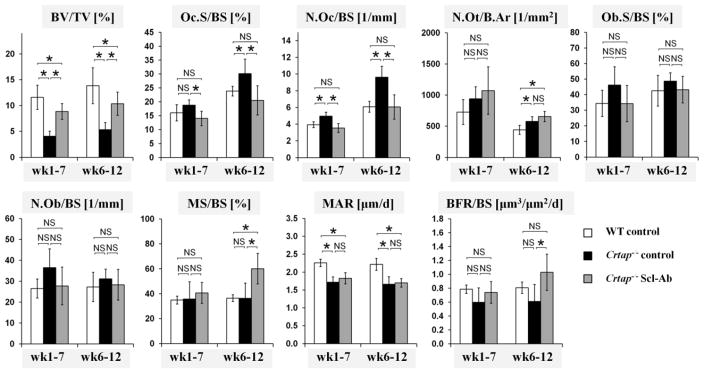
Fig. 3.
Histomorphometry analysis of vertebrae L4 of WT, control Crtap−/− mice and Scl-Ab treated Crtap−/− mice. Shown are bone volume/total volume (BV/TV), osteoclast surface/bone surface (Oc.S/BS), osteoclast number/bone surface (N.Oc/BS), osteocyte number/bone area (N.Ot/B.Ar), osteoblast surface/bone surface (Ob.S/BS), osteoblast number/bone surface (N.Ob/BS), mineralizing surface/bone surface (MS/BS), mineral apposition rate (MAR) and bone formation rate/bone surface (BFR/BS). Data are shown as means ± SD, n=6 per group. *p<0.05 between indicated groups, NS=not significant.

