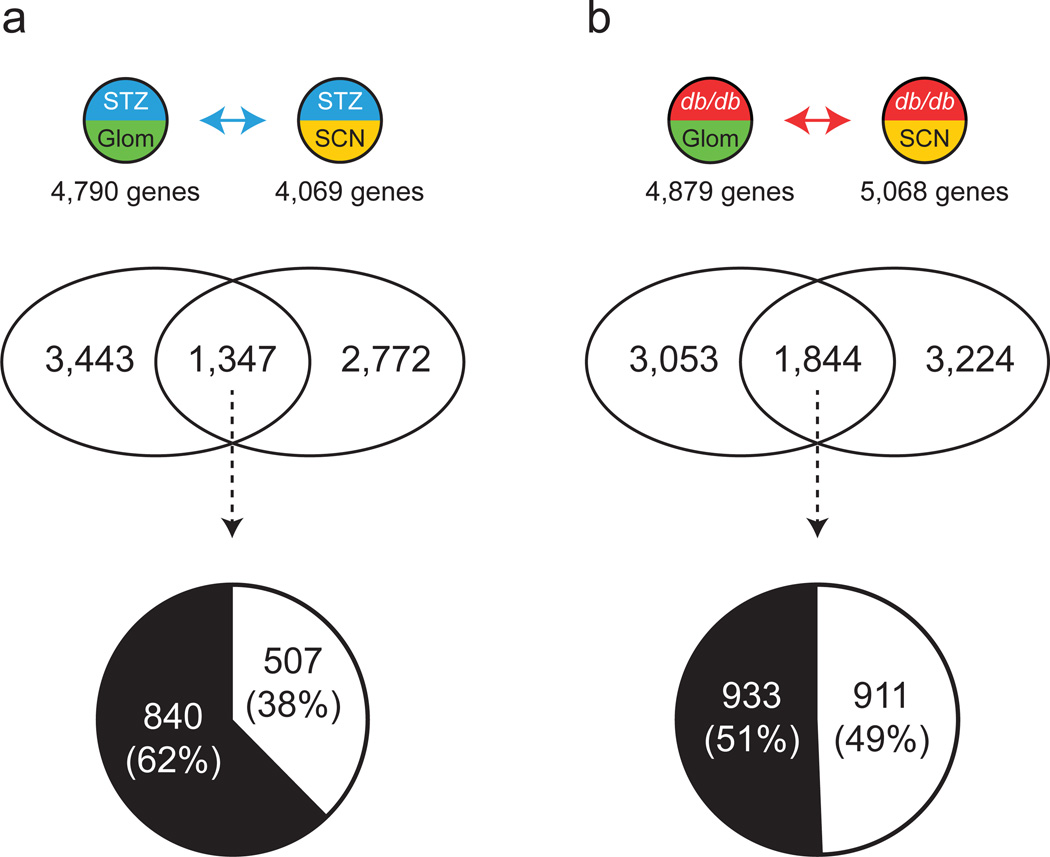
Fig. 2.
Comparison of kidney and nerve DEGs. Venn diagrams depict shared and unique DEGs from Glom and SCN in type 1 diabetes (a) and type 2 diabetes (b). The pie charts show percentages of concordant (change in same direction; white) and discordant (change in opposite direction; black) shared DEGs. See Fig. 1 for key

