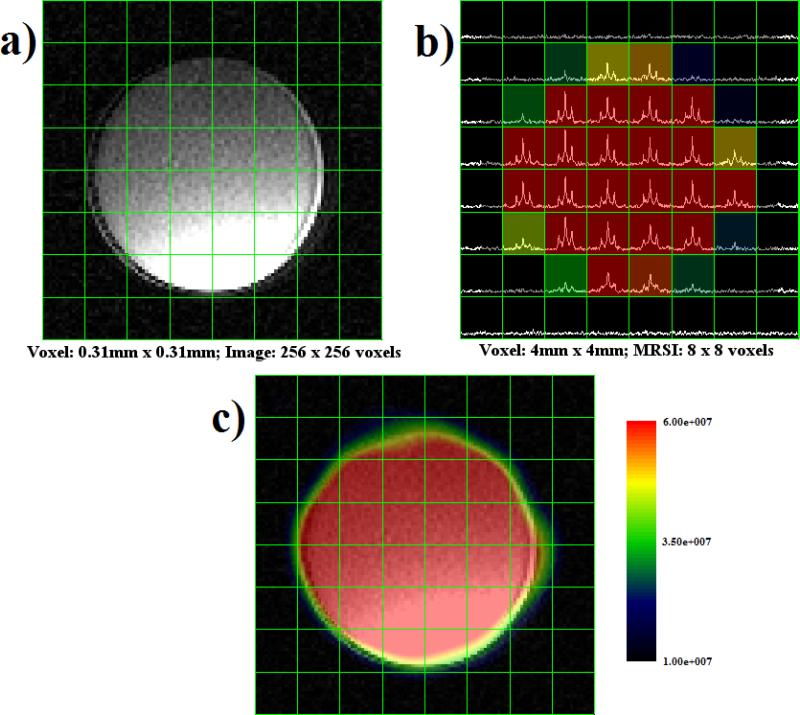
Figure 6.
Montage of ethylene glycol image and spectroscopic data. (a) Proton MRI with 8 × 8 grid overlay. (b) MRS data presented in each voxel, with peaks corresponding to 13C chemical shift. (c) MRSI generated from spatial and spectral data representing ethylene glycol concentration. The color overlay was spatially smoothed using a sinc kernel in SIVIC.

