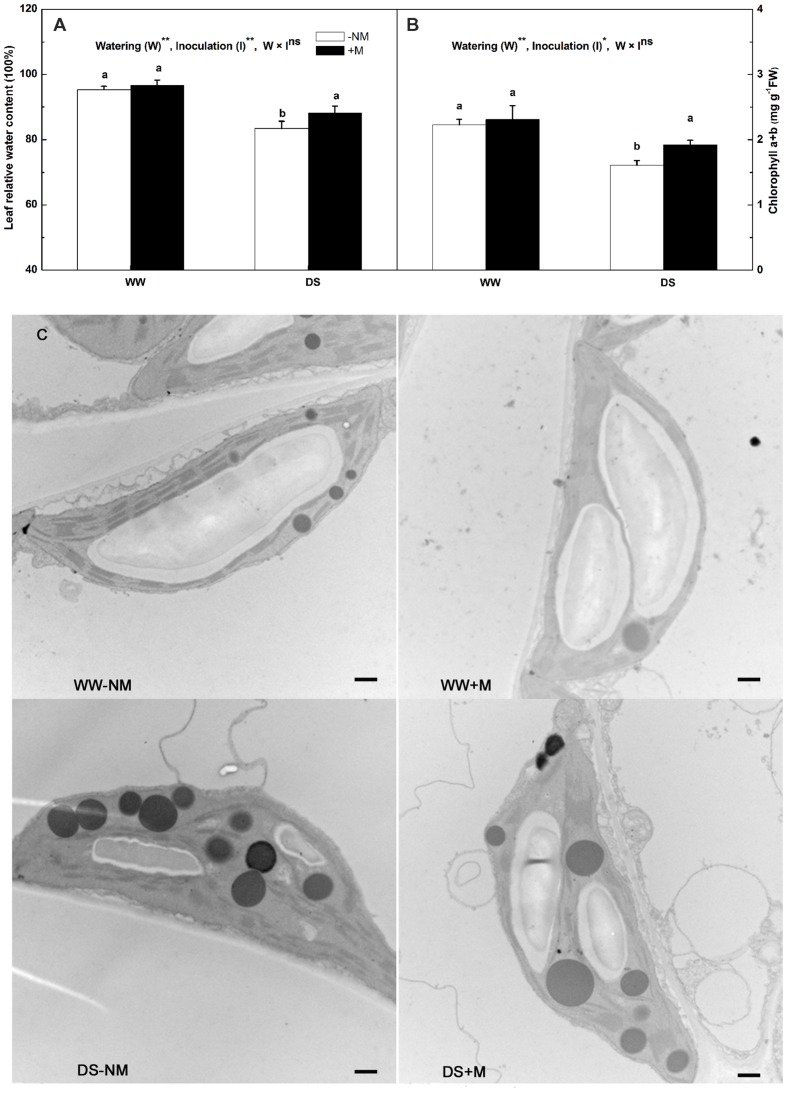
FIGURE 2.
Leaf relative water content (RWC; A), chlorophyll concentration (B) and chloroplast ultrastructure (C) of mesophyll cells in mycorrhizal (+M) and non-mycorrhizal (-NM) watermelon seedlings grown under WW and DS conditions. Scale bars: (C) 500 nm. T-test was performed to compare differences between inoculation treatments under the same water treatment. Different letters following the values indicate significant differences between treatments at P < 0.05. Two-way ANOVA output: ns, not significant; ∗P < 0.05, ∗∗P < 0.01. Data represent the means ± SD of six replicates.

