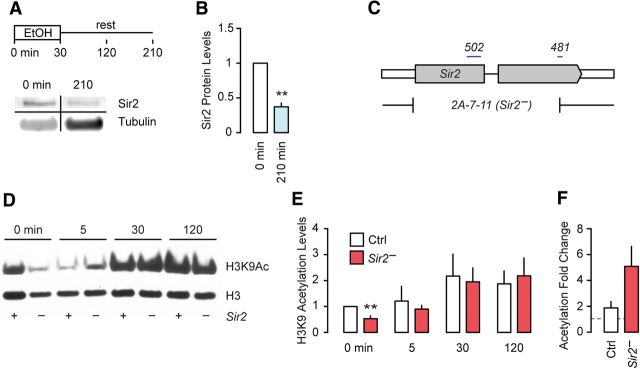
Figure 1.
Levels of Sir2 and histone acetylation in fly heads following short-term exposure to ethanol. A, Schematic diagram of experimental procedure, and Western blot detecting Sir2 and tubulin proteins (bands rearranged from a single blot). B, Quantification of Sir2 expression normalized to tubulin, relative to unexposed flies (n = 3). C, Schematic diagram of Sir2 coding region (gray) depicting boundaries of the 2A-7–11 deletion (Sir2−) and regions used to generate the 502 and 481 RNAi lines. D, Western blot of control (+) and Sir2− (−) heads for acetylated and total H3K9 for the indicated time points during/after ethanol exposure. E, Quantification of D showing H3K9Ac levels normalized to total H3, relative to untreated controls (n = 5). F, Total fold change in H3K9 acetylation in control and Sir2− flies between unexposed and ethanol-exposed flies (n = 5). Error bars indicate the SE. **p < 0.01.

