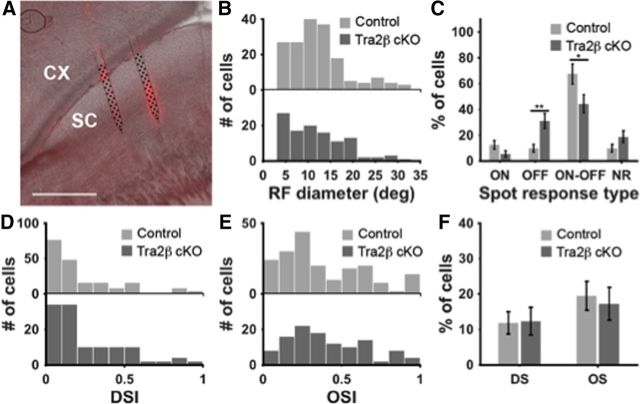
Figure 6.
Visual response properties of SC neurons in control and Tra2β cKO mice. A, Parasagittal section through the SC in a control mouse (right, anterior; left, posterior) showing DiI traces indicating the location of the inserted probe (red), schematic of the 64-channel probe is shown in black. B, Histograms indicating receptive field (RF) diameters of cells as measured in flashing spot responses. There were no significant differences between controls and Tra2β cKO RF size distributions [Kolmogorov–Smirnov (KS) test, p > 0.05]. C, Percentage of the ON, OFF, ON–OFF, and nonresponsive (NR) neurons in response to the flashing spot stimulus. Error bars represent SD. Significant increase of OFF cells, and significant decrease of ON–OFF cells were observed in Tra2β cKO mice. **p < 0.01 and **p < 0.05, respectively. D, E, Histograms of the DSI and OSI of cells measured in drifting sinusoidal grating stimulus. There were no significant differences between control and Tra2β distributions (KS test, p > 0.05). F, Percentage of the OS cells and DS cells. There were no significant differences between control and Tra2β cKO (p > 0.05).

