Figure 1.
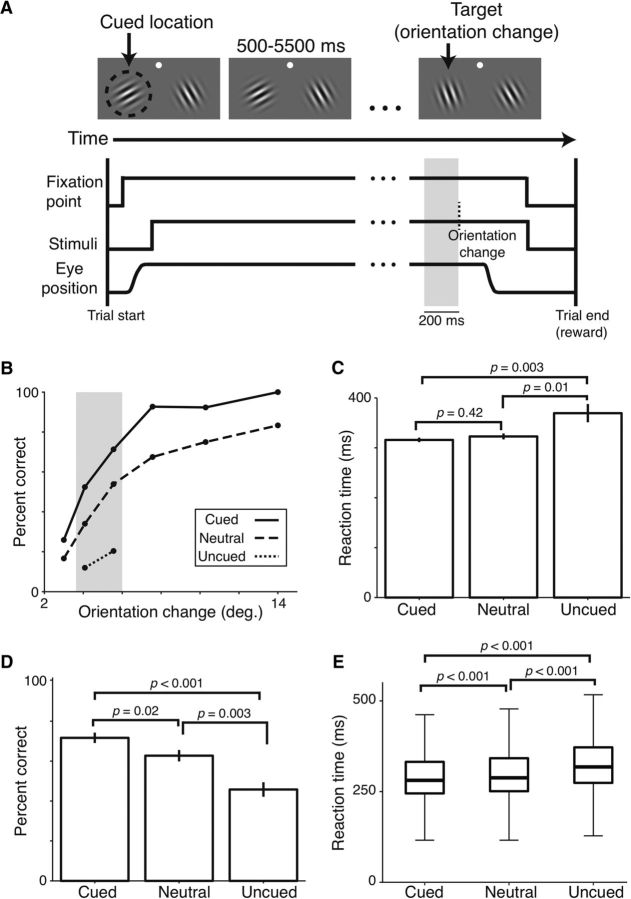
Detection performance and reaction times are graded across cueing conditions. A, Top, Visual display during task. White dot indicates the fixation point. Dashed circle (not visible during task) represents the location cued during instruction trials and, in this example trial, also the location of the orientation change. Bottom, Time course of task events. Vertical dashed line indicates the time of the orientation change. Gray band represents the 200 ms epoch just before the orientation change analyzed for Figures 1–3 and 4A. B, Single-session detection performance as a function of the size of the orientation change for the three cueing conditions. Gray band represents the stimulus difficulty levels used for all subsequent analyses, except Figure 4. C, Single-session reaction times for the stimulus levels in the gray band in B. D, Mean detection performance across all 26 recording sessions. E, Median reaction times (thick horizontal lines) and interquartile range (box) across all recording sessions; whiskers extend 1.5 times the interquartile range beyond either end of each box. C–E, Wilcoxon rank sum tests. C, D, Error bars indicate SEM.

