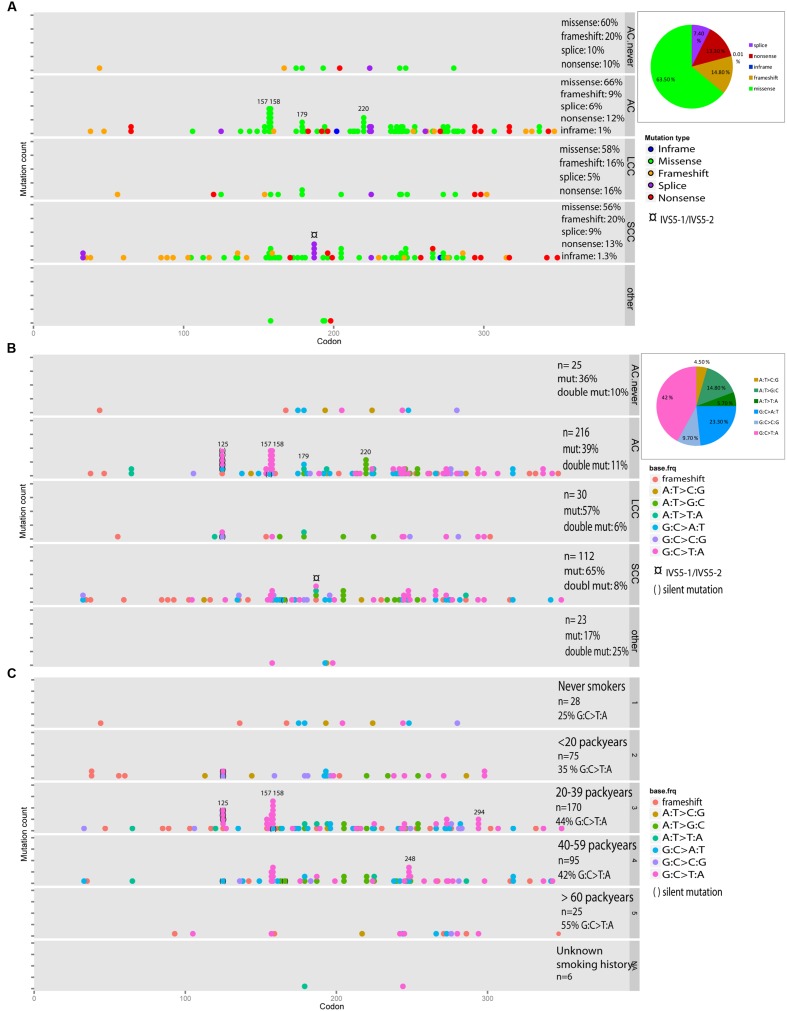
FIGURE 2.
TP53 mutation spectrum in subtypes of lung cancer. AC with no smoking history are called “AC.never.” Double mutations are included (A–C), and calculated as the number of double mutations divided by the total number of mutations. Silent mutations are included (B,C). A pie chart shows the fraction of each category. (A) Distribution of mutation type across the gene is illustrated for the different types of histology. (B) Distribution of base change types in the histological subgroups. (C) Distribution of base change types in groups with different smoking history.

